This Microsoft Excel® spreadsheet presents a ten-by-ten correlation matrix.
There is a symbols tab where you enter symbols and price formatting, such as two decimal places, etc. The quote displays along the top and bottom use the same symbols as the correlation matrix, taken from the symbols tab.
The top of the correlation matrix displays the symbols' long descriptions. Each column has a gradient background that alternates from left to right or top to bottom, which matches the gradient background of the long descriptions along the top of the matrix.
You can change the time frame and look-back period. Please use ADC for daily bars. Also, the correlation matrix is heat-mapped for the top five correlations (green) and bottom five correlations (light blue).
At the end of each row in the correlation matrix is a Chart toolbar button. Clicking this will update the scatter-gram chart at the bottom to display the current correlations in that row versus the market listed in the first column of the row. The symbols and current correlations are detailed in the scatter-gram chart.
The left side of the dashboard display frequency distributions of each of the correlations between the main market (displayed at the top) and the ten markets. The frequency distribution analysis is over the past 100 bars.
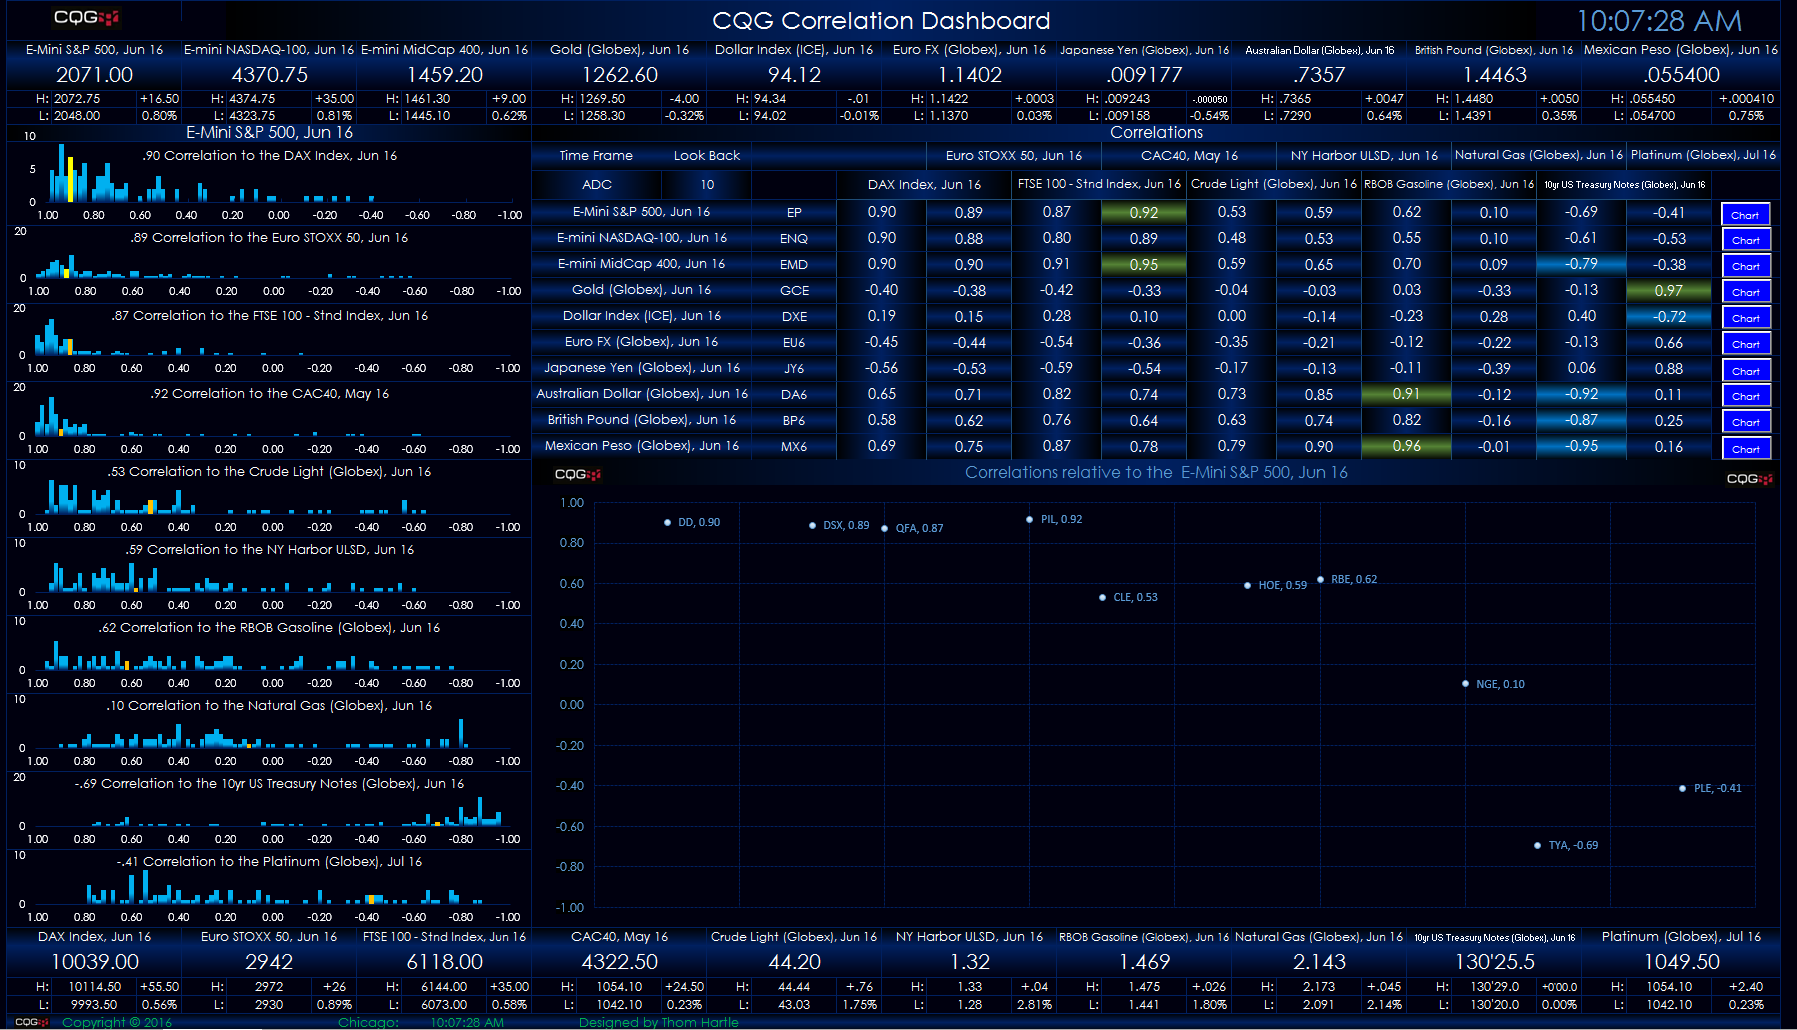
Frequency distribution analysis simply counts the number of times a particular value occurs in a range of values. A simple explanation of frequency distribution analysis is found here.
Please note, you will need to enable macros for full spreadsheet functionality.
Requires CQG Integrated Client or CQG QTrader, data enablements for all symbols displayed in this spreadsheet, and Excel 2013 or more recent.