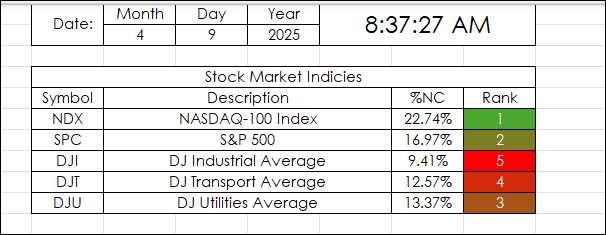
This Excel Dashboard uses RTD Calls to pull in the Net Percent Change of a collection of markets by a particular date.
For example, April 9, 2025:
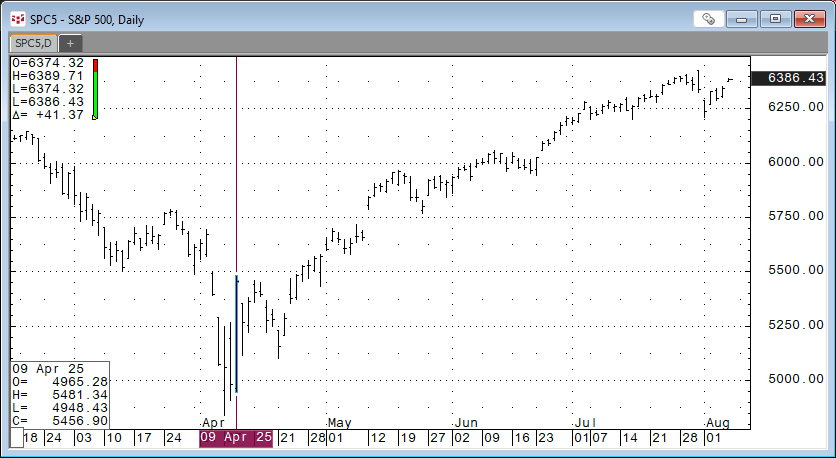
"Markets News, April 9, 2025: Dow Jumps 3,000 Points, Nasdaq Soars 12% as Trump Pauses Tariffs; S&P 500 Has Best Day Since 2008."" Source: https://www.investopedia.com/
Below shows the market's reaction on the daily bar chart.
The downloadable Excel dashboard offers a date input and uses RTD formulas to pull in today's percent net change by date.
The RTD formula is:
= IFERROR(RTD("cqg.rtd",,"StudyData",B6, "PCB","BaseType=Date,Price=1000,Index=2000,Date="&$C$2&"/"&$D$2&"/"&$E$2&"", "Close", "D",,"all",,,,"T")/100,"")For futures markets the “ADC” time interval is used. (Equalized active daily continuation).
= IFERROR(RTD("cqg.rtd",,"StudyData",K21, "PCB","BaseType=Date,Price=1000,Index=2000,Date="&$C$2&"/"&$D$2&"/"&$E$2&"", "Close", "ADC",,"all",,,,"T")/100,"")Multiple sets of markets are used.
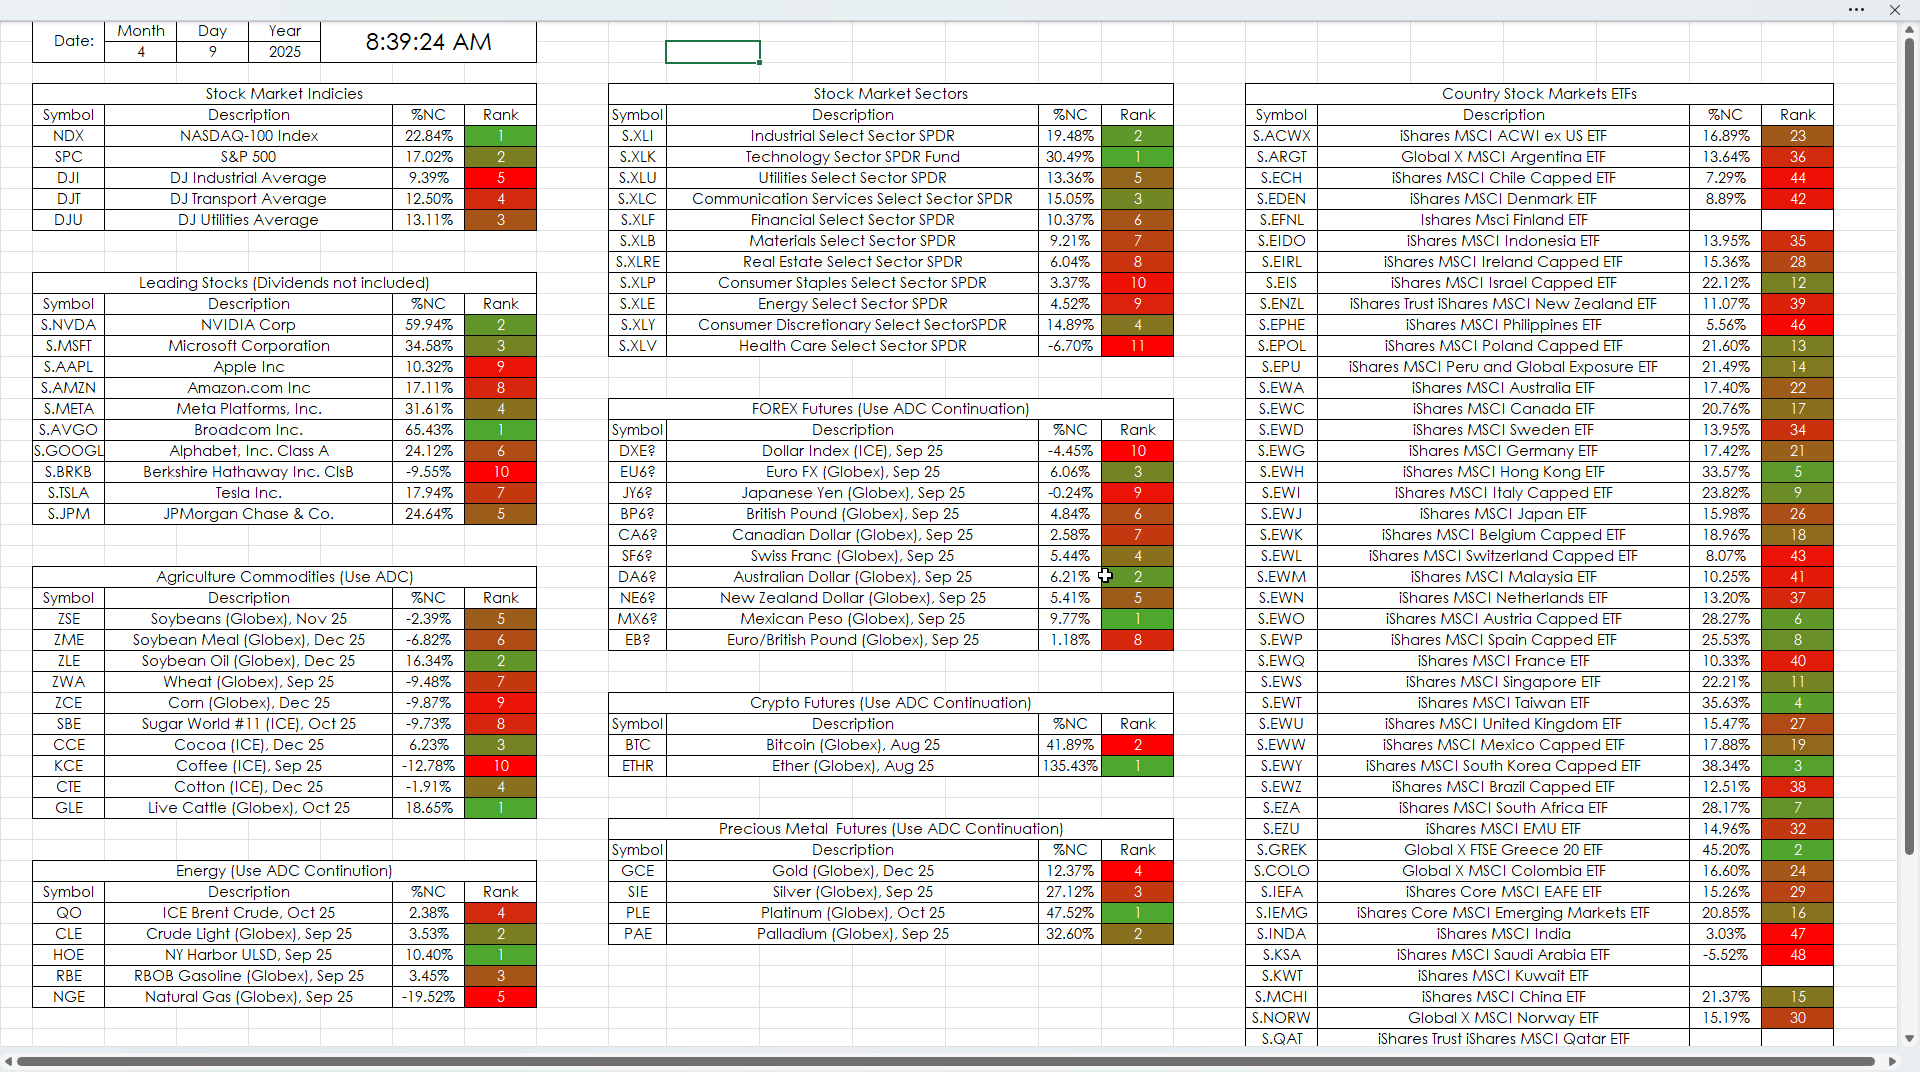
In addition, the percent net changes are ranked within the sets using the RANK and COUNIF functions to avoid ties.
=IFERROR(RANK(H6,$H$6:$H$10)+COUNTIF($H$6:H6,H6)-1,"")
The downloadable sample is not locked. It can be arranged, and symbols can be changed.
Requires CQG Integrated Client or CQG QTrader, data enablements for the NYSE and Nasdaq stocks, and Excel 2016 or more recent.