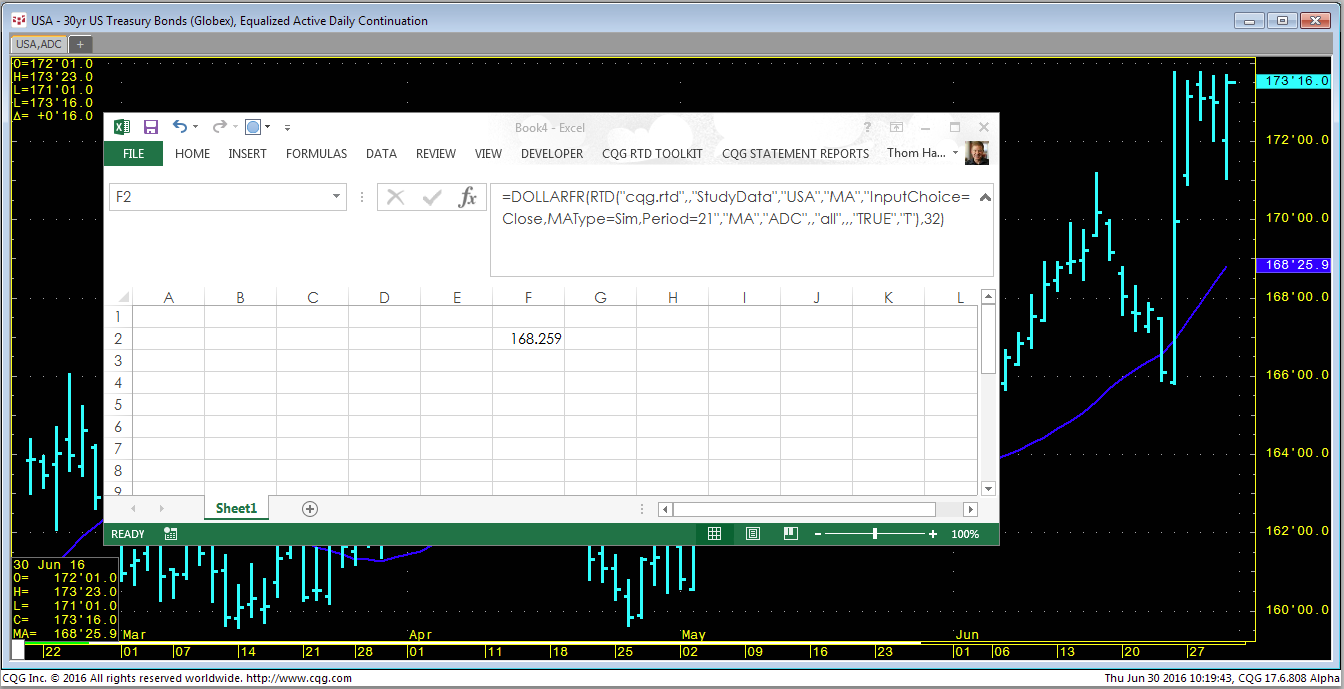
When pulling a study value into Excel using RTD, you may not see the same value in Excel that you see on a chart. It is important that the RTD formula uses the same parameters as applied to the chart.
For example, in the chart we see the 30-year US Treasury futures contract (symbol: USA) with a 21-day simple moving average. Let's use this standard Excel RTD formula for a simple moving average:
= RTD("cqg.rtd",,"StudyData","USA", "MA", "InputChoice=Close,MAType=Sim,Period=21", "MA","D",,"all",,,,"T")The above formula in Excel will not match the study value on the chart. There are a number of reasons: First, the chart is set to display bond prices in fractions and the RTD formula is set to use decimals (…",,,,"T"). We can replace the T with D. Using D will give you a raw number with no separation for the 32nds portion in the price. You will see 168259, not 168.259 where the price is 168 & 25.9/32nds. The next problem is the chart is set to use “Equalized Active Daily Continuation.” So we need to set the RTD formula to use ADC instead of D for the time frame and we need to turn on Equalize Closes:
=RTD("cqg.rtd",,"StudyData","USA","MA","InputChoice=Close,MAType=Sim,Period=21","MA","ADC",,"all",,,"TRUE","D")The above RTD formula now uses ADC and the "TRUE” near the end of the RTD formula turns on Equalize Closes. Still though, CQG is using fractions for the moving average study value with a decimal for the 32nds. To match that, we need to bring the study value in as a decimal and use the DOLLARFR Excel function. This function will convert a decimal into a fraction. We set the DOLLARFR function to convert the decimal into 32nds:
=DOLLARFR(RTD("cqg.rtd",,"StudyData","USA","MA","InputChoice=Close,MAType=Sim,Period=21","MA","ADC",,"all",,,"TRUE","T"),32)Now, Excel and the chart match. Both display 168.259.
For more information about formatting price data in Excel, please visit http://news.cqg.com/blogs/excel/2011/05/formatting-price-data-using-rtd-and-excel
