Chapter 3 of Trading Time called Concepts of Time, is for me the most important chapter of the book. It was the quantum leap in my thinking up to that point and was the first examples of the creations of Multiple Timeframe Visualizations in one chart. Up to that point, I and anyone who I'd ever built anything for, concentrated on a single timeframe for the process of building a trading system. For sure, once done, it could then be tested and applied to other timeframes and then spliced together, to create a smoother monetary output and more stable statistics of risk.
Whilst all well and good, it meant that many systems, especially intraday ones, were highly active and intensive and with that came the associated problems of cost of execution and order integrity and execution in real time. I had already worked out how long a trade could last in any timeframe or market before a correction was probable and built appropriate exit code and method, but this continually presented the problem of what to do and what to build if the trend then restarted after that correction.
The solution was the birth of what I call Step Theory. Originally, using the basis of the Standard Slow Stochastic it measured the relationship between price and when the Stochastic crossed and applied a positive integer to Steps Up Value, or Down Value depending on what that crossover relationship was. Once Steps had reached a certain threshold that was the trending timeframe. Armed with the knowledge that no trend can last forever in the same timeframe it was inevitable that at some point the trend would end and the Step Value would reset to zero. The leap forward in thinking was then to apply the same Step concept to the next higher timeframe and if it had reached that same threshold then the trend had moved up to that timeframe and therefore the trade continued. This process was continuous. The end of Concepts of Time showed a case study on the Australian stock market where the trade began on 50-minute chart in 2004 at 3,600, (obviously with the trading risk that is appropriate to a 50-minute system), with the trade still being live and with a trending timeframe of weekly in January 2006 at 5,100 when the book went to print. In the end the trade lasted until July 2007 with the Index at over 6,000.
It is almost impossible to overemphasise the staggering difference this makes. Effectively it opens up the ability to define risk on an intraday chart and ride the trend as the trending timeframe moves up. The reality is on Futures markets it is rare to reach the Daily Time Frame from intraday beginnings, but the fact that individual stocks, Index's and Sectors are the asset class that trend far longer enable trades to last for years.
A major development since writing the book, is that the visualisation has changed significantly. Originally, each timeframe was shown individually, which made for an ugly study and the use of multiple windows. Now a Custom Study allows all the timeframes to be shown as one study.
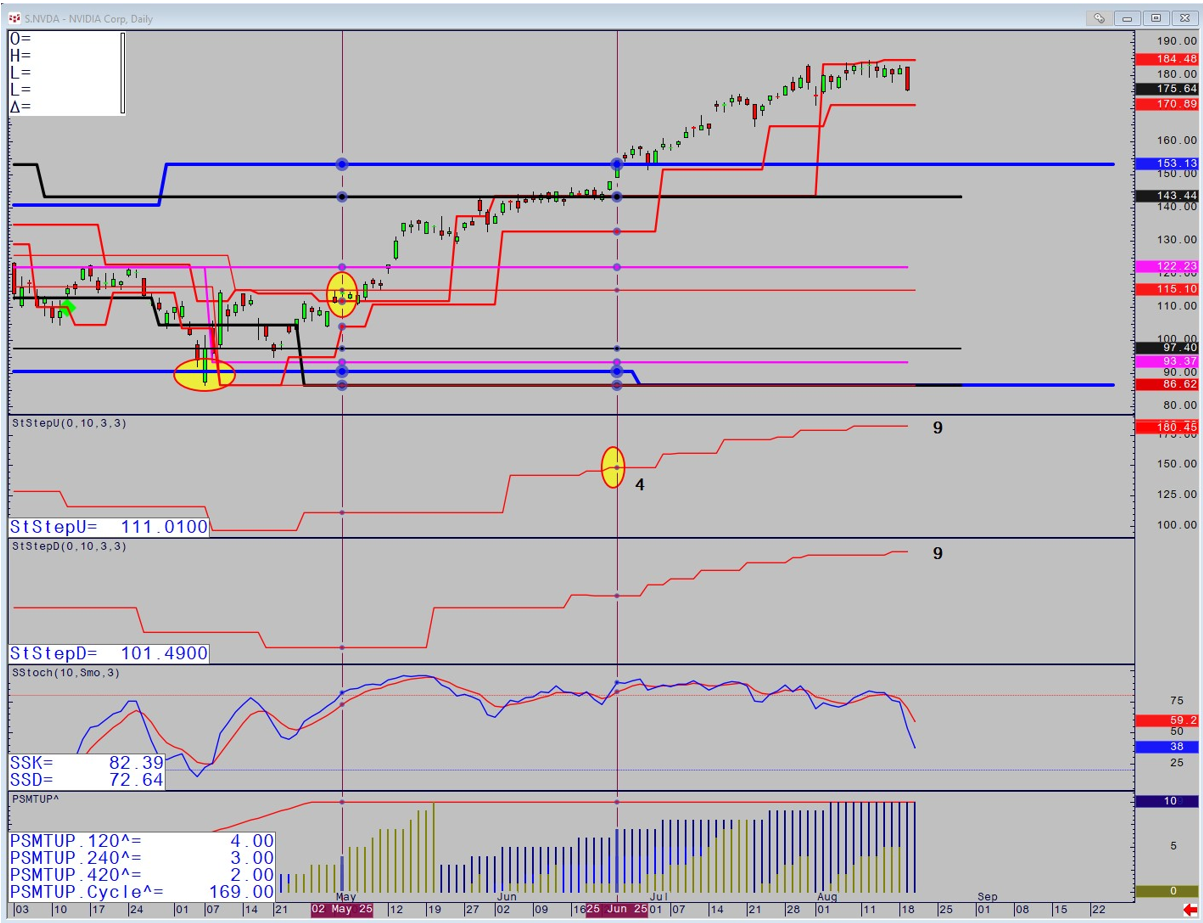
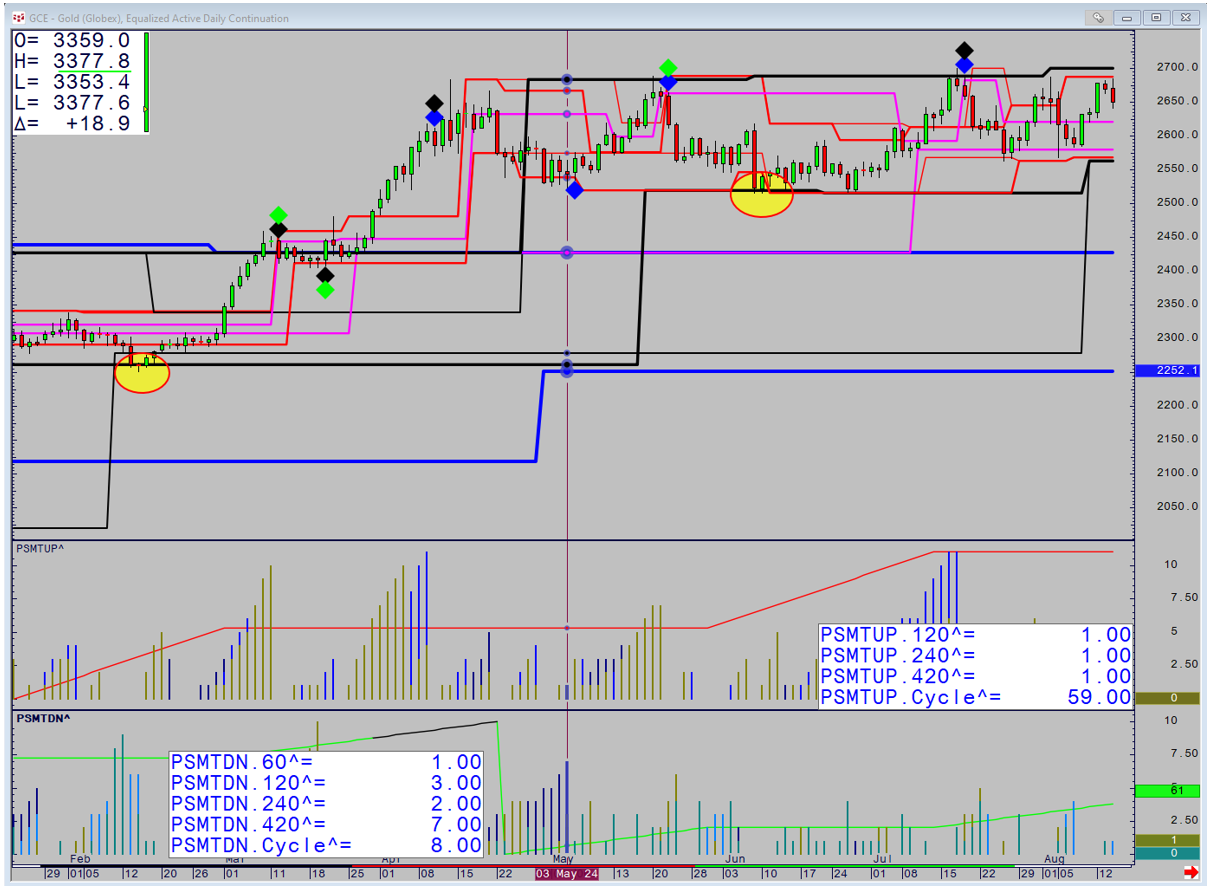
In order for a timeframe to be the one trending it has to have stepped consecutively 4 times in the same direction from a higher price than previously in an uptrend and vice versa. This is recorded by the study referencing the price when the Stochastic crossed. In order for the trend to move up a timeframe the next highest next would then have to reach 4. Finally once a Step reaches 7 and then resets to zero by stepping to a lower price in an uptrend, the trend is then deemed to have ended. On daily charts the study references the 120-minute, 240 and 420 and are marked by diamonds. The two custom studies' record the stepping up and down process.
The sequence of Gold Charts explain how a trend develops. It began by price holding the Weekly Based Peak Expansion Level as circled. Price then rallies with the 240-minute being the trending timeframe at 10 steps. The following Day it resets to zero meaning the uptrend is over.
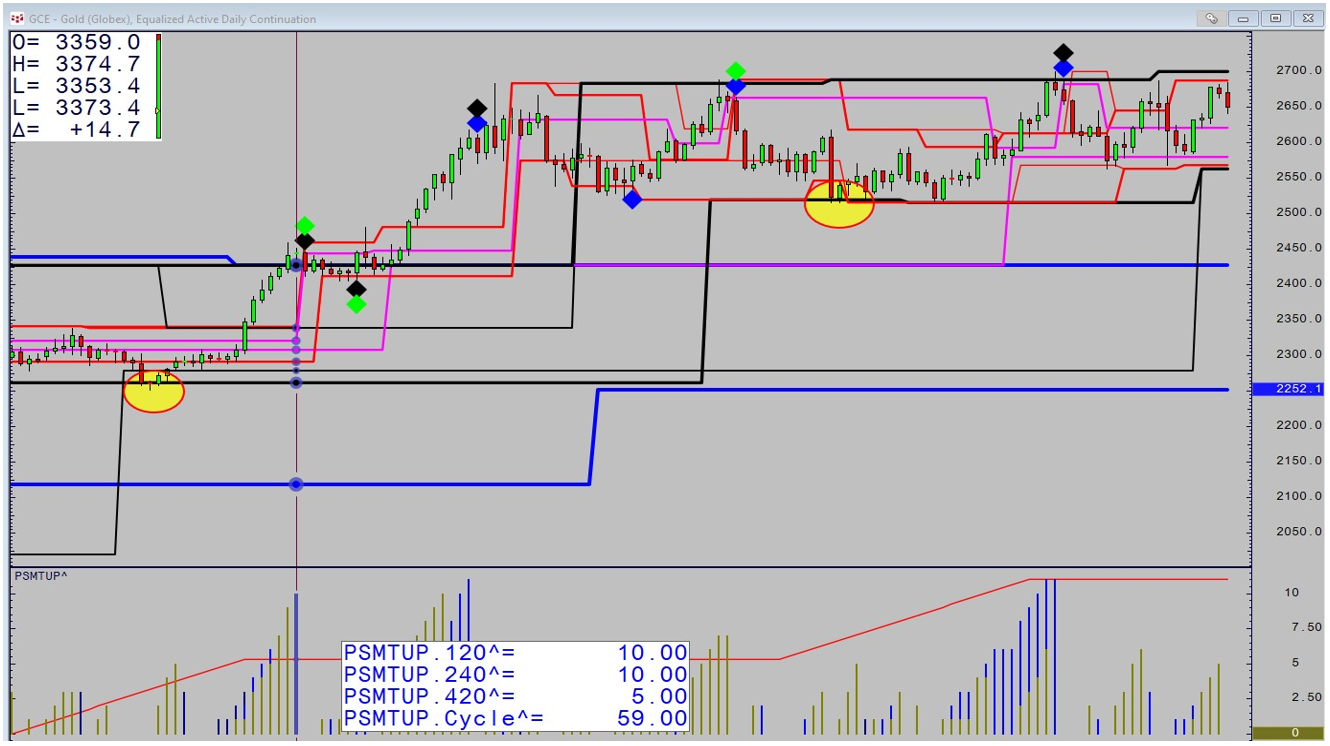
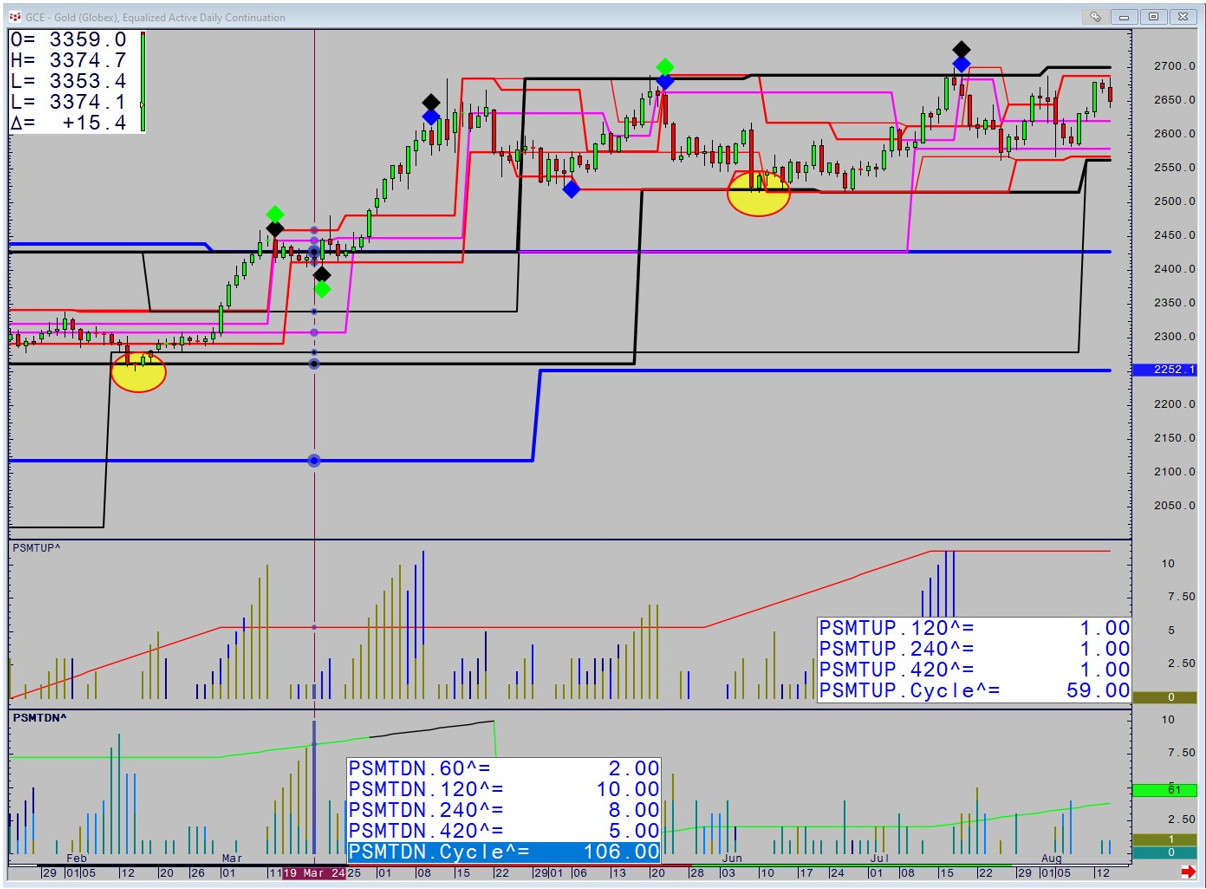
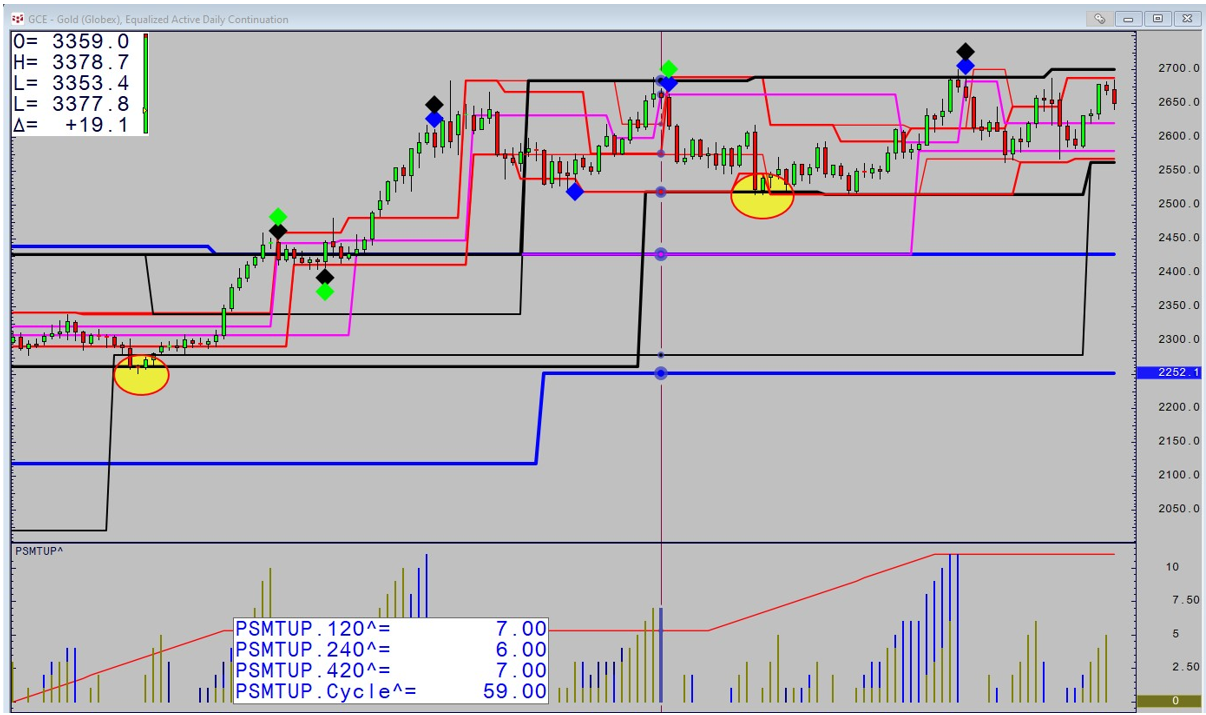
There follows a move back down which holds support before the 120 and 240 resets meaning the downtrend is finished.
Price embarks on a powerful rally that sees the trending timeframe reach the 420 before resetting.
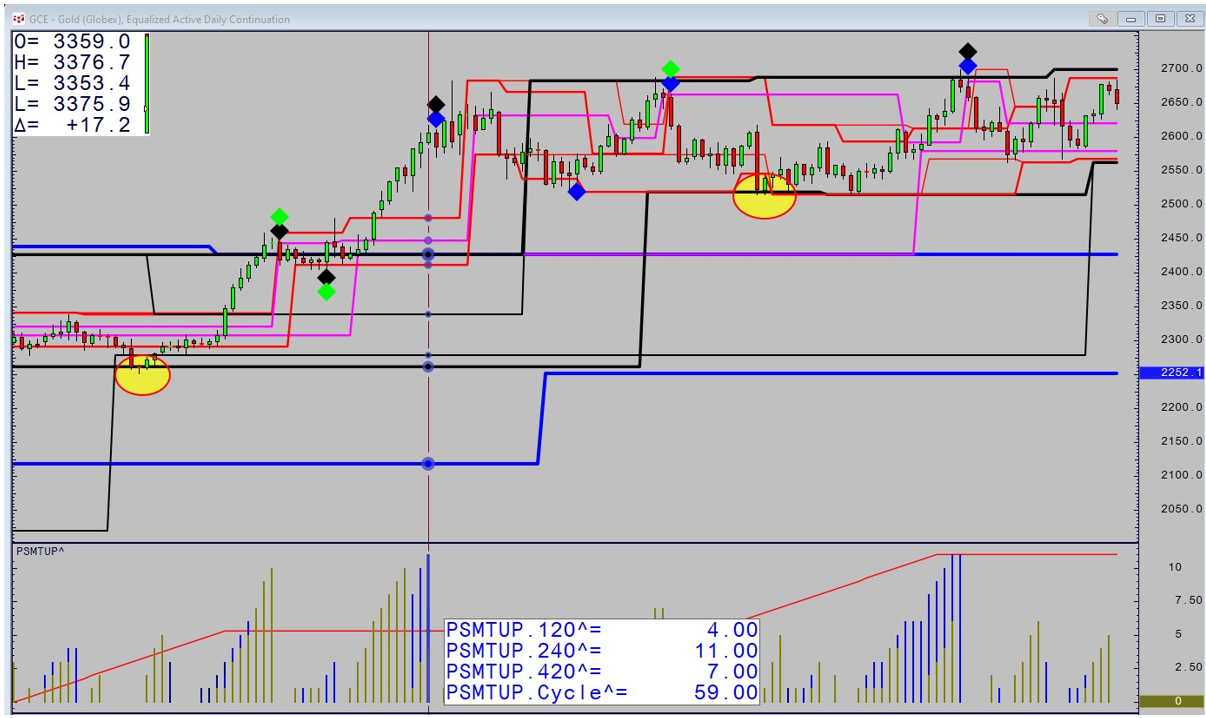
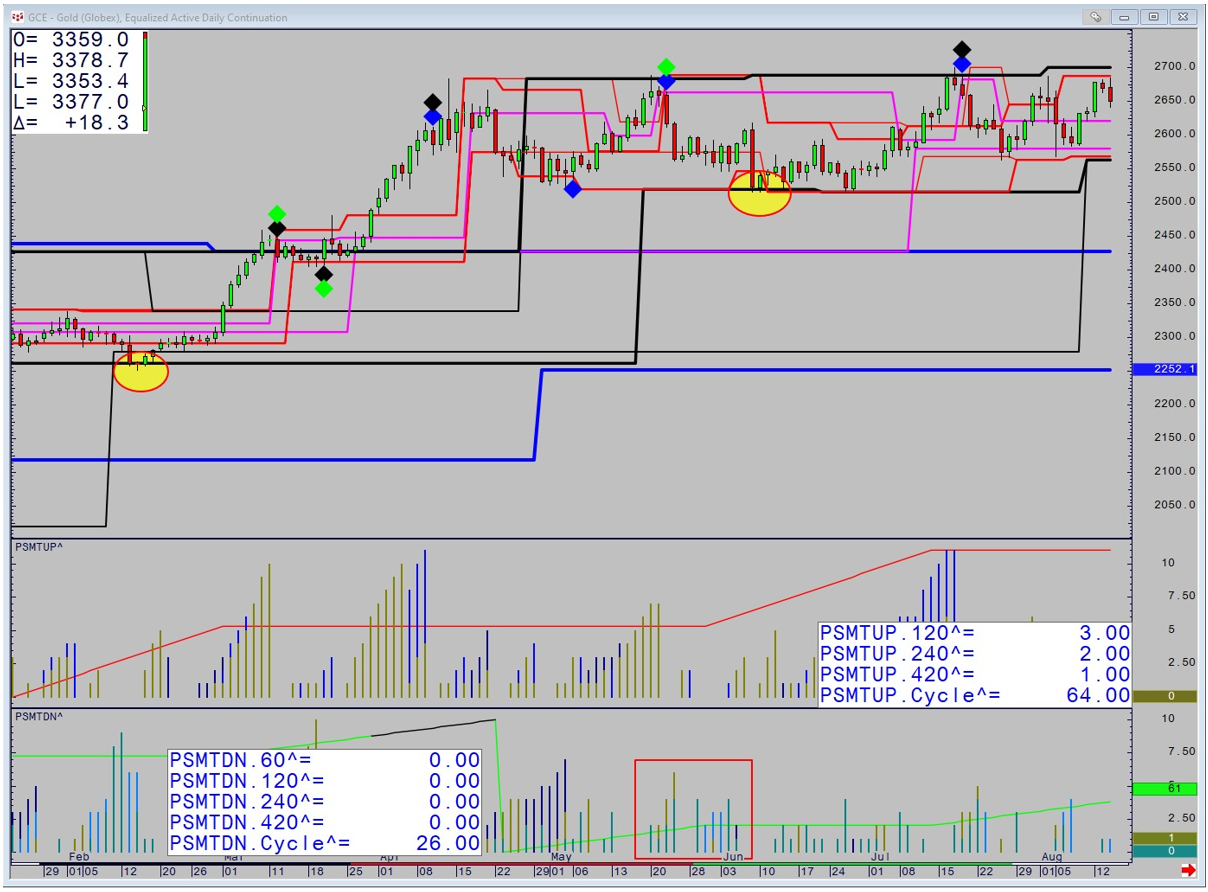
Price does make new highs before correcting back down and once again ending on the 420.
Once again price moves up directly to the final weekly based resistance and the Uptrend ends. Steps that end at major support or resistance have more power and allow for a reversal trade. Price moves back down to major support as circled. The fact that no Stepping process happened means that the downtrend was weak and lacking momentum.
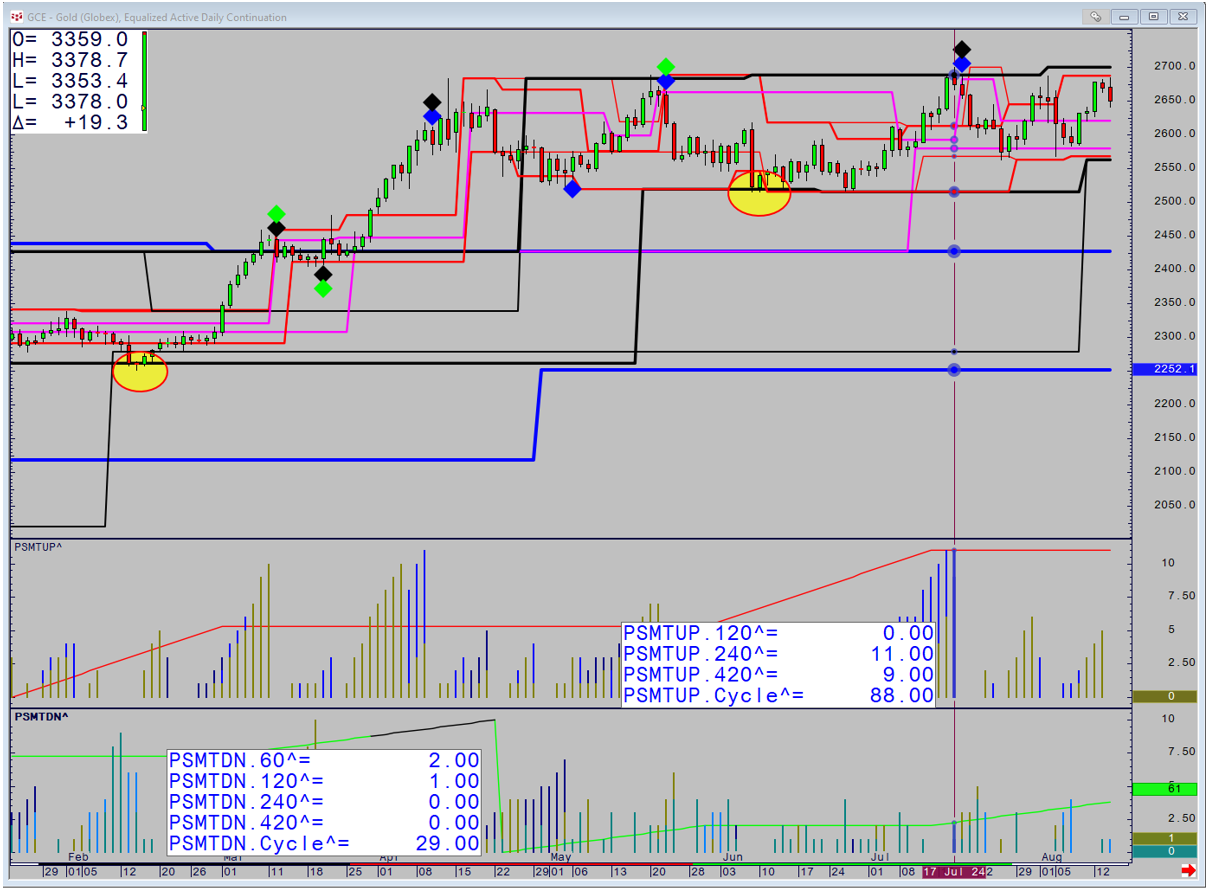
Finally we bounce once again and fail at the weekly resistance once more.
Looking at Stocks the original study works better as trends last longer. The strongest trend is when the Daily Charts Steps are both over 4. Having held Monthly based support in April, Nvidia began trending intraday on May 2nd on the 120-minute and has continued to Step up. Just when price reached final resistance the trend Stepped up to 4 on the daily and price has continued to rally. The last Step up was from the price of 180.45 so we know that in order to prevent the trend ending on the daily timeframe, the Stochastic must cross up above 180.45.