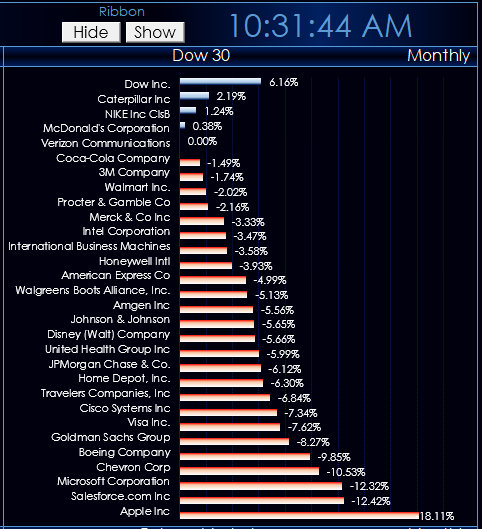
This Microsoft Excel® dashboard uses ranked by percent net change for two sets of 30 symbols. The dashboard is preloaded with the stocks comprising the Dow Jones Industrial Average® and 30 futures symbols.
This dashboard will give you an easy to read view of the performance of the markets on multiple time frames. You can enter in your own symbols. The long description is next to the symbol so you know the symbol is accurate. Then, there are four panes displaying the ranked performance for each symbol group. You can enter in the time frames for the symbol group. The default is 15 (minutes), D (Daily), W (Weekly) and M (monthly). Also available are Q (Quarterly), S (Semi-Annual) and A (Annual). You can enter in a title for the charts.

On the main display there are two macro buttons to hide or show the Excel ribbon for better screen management. Before closing the spreadsheet, please click "Show."
Requires CQG Integrated Client or QTrader and data enablements for the products.
DJIA and Dow Jones Industrial Average are registered trademarks of Dow Jones Trademark Holdings LLC (“Dow Jones”).