This post details two pages with a general overview of the agriculture markets. These pages are to help you navigate all the possible underlying contracts and data points you may or may not know are available. For example, the WASDE page contain crop data in a format that highlights the standard desired data points.
The two pages are loaded when the PAC is installed: AG Board and WASDE. You will see the pages listed when you click the Page button in IC or QTrader. Links are at the bottom of the post for CQG Desktop and CQG 1 pages.
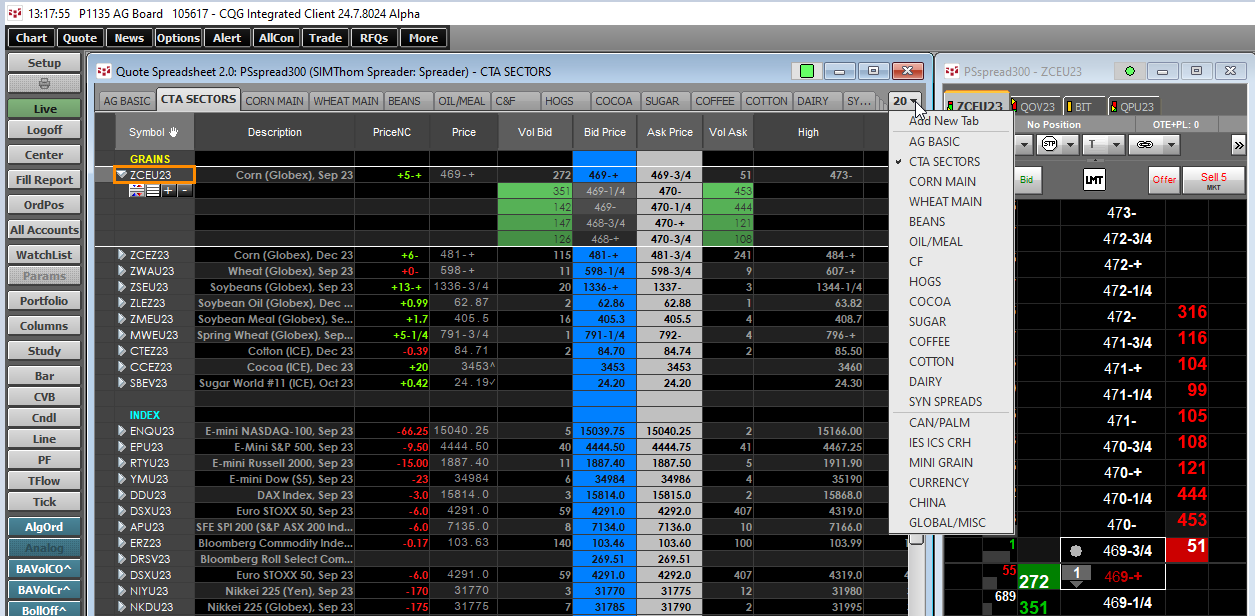
The AG Board page displays the Quote Spreadsheet V2 with 20 tabs of market data by crops and other groupings.
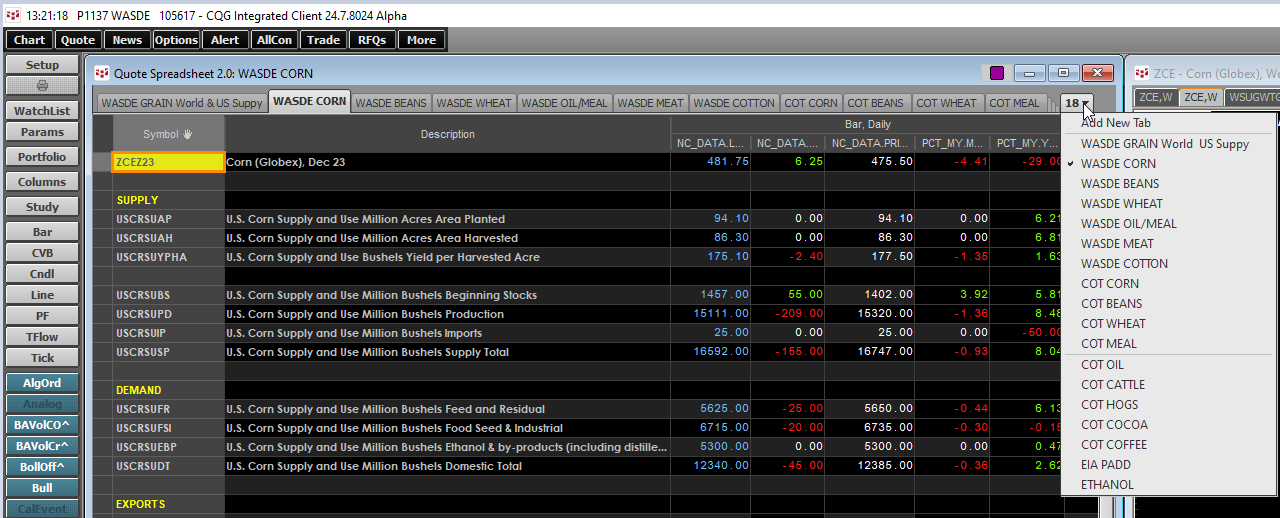
The WASDE page has the Quote Spreadsheet V2 with 18 tabs of market data by crops and other groupings.
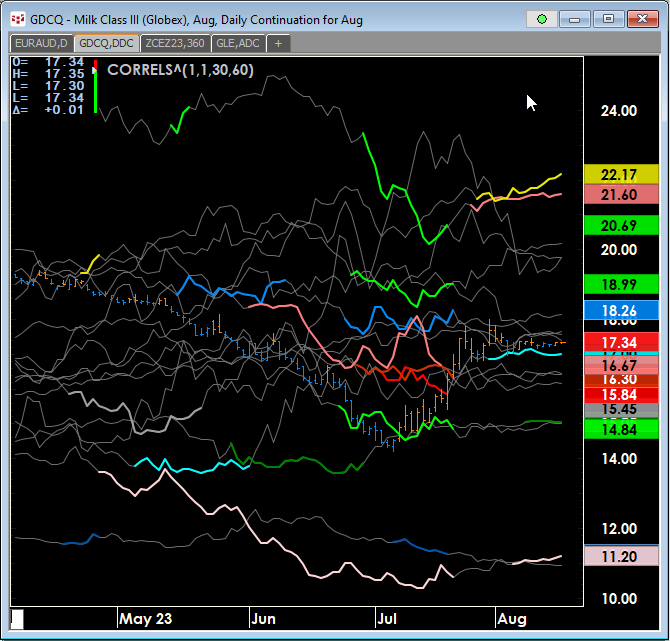
The AG Board page displays charts, which are linked to the QSS V2. There are custom studies, such as the CORRELATION_SEASON study. This study enables you to set the lookback period for correlation analysis of the current price to each of the individual (up to 20) previous years' price action. A parameter is available to highlight the individual seasonal lines if the correlation exceeds a user input value.
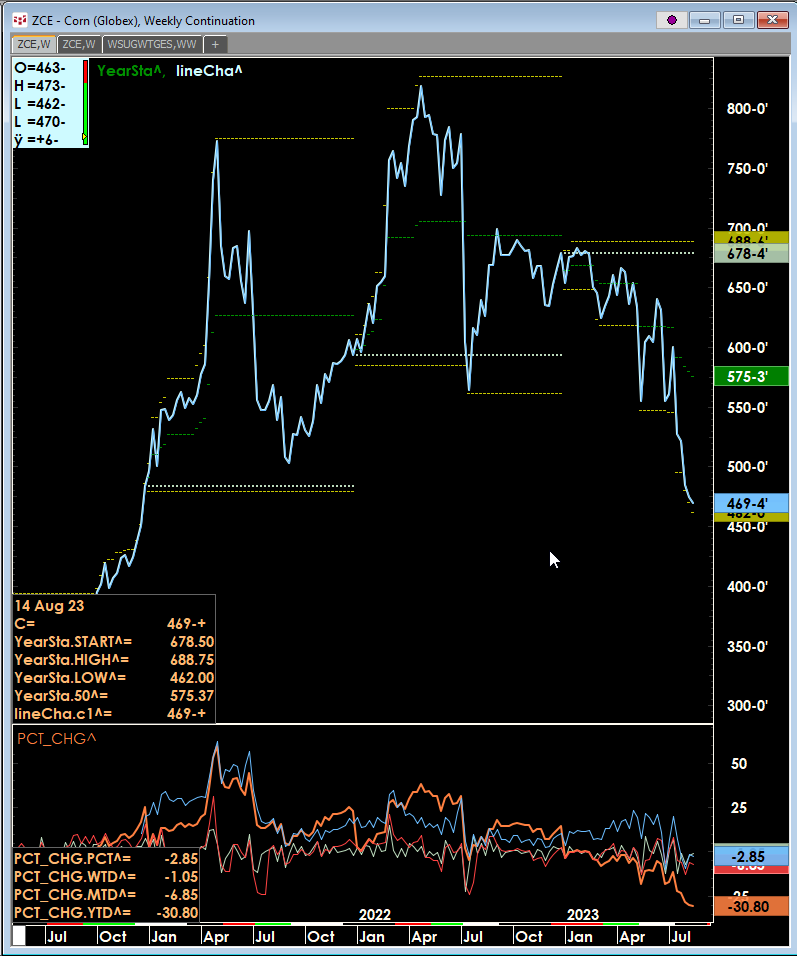
The WASDE page displays charts, which are linked to the QSS V2. There are custom studies, such as the YearStart_HL study and the PCT_CHG study. The YearStart_HL study details the prices for start of the year, high of the year and low for the year. The PCT_CHG study plots the weekly, monthly and yearly percent change for the year.
Here is a list of the custom Agriculture Studies provided in the PAC:
- 20-year Seasonal Study - set the lookback period for correlation analysis of the current price to each of the individual (up to 20) previous years' price action and highlight the individual seasonal lines if the correlation exceeds a user input value.
- Gap Lines Study - marks gaps where you may find interesting retracement or breakout levels.
- Straddle Study - takes the previous days at the money straddle against the current days open and displays lines on the chart.
- VWAP Study - set to a preferred day starting point among other settings. The current default starts at the beginning of year 2023.
- TL2 Study - draws trend lines from set peaks.
The goals of this post are twofold: One, as a key for symbols and data for agricultural markets and a key for symbols for USDA WASDE data. Two, to illustrate the depth of coding available for writing custom studies as technical aids for analysis.
Links to import pages to CQG Desktop and CQG 1:
- Ag page Desktop: https://m.cqg.com/cqg/assetpac/634b5c1f-e649-4786-bd00-133b997e7bd0_pG902395a3c4e4be-9fda-4944-ae4c-ef2373f647b3
- WASDE Desktop: https://m.cqg.com/cqg/assetpac/634b5c1f-e649-4786-bd00-133b997e7bd0_pG902395c31843f2-5469-4473-894e-a33750fc8708
- Ag page CQG 1: https://m.cqg.com/one/assetpac/634b5c1f-e649-4786-bd00-133b997e7bd0_pG902395a3c4e4be-9fda-4944-ae4c-ef2373f647b3
- WASDE CQG 1: https://m.cqg.com/one/assetpac/634b5c1f-e649-4786-bd00-133b997e7bd0_pG902395c31843f2-5469-4473-894e-a33750fc8708