The Excel VSTACK function appends arrays vertically and in sequence to return a larger array.
Syntax:
=VSTACK(array1,[array2],...)
As an example, the post "Market Performance Dashboard" has seven tabs:
Symbols & Data — Blocks of symbols for the other tabs and the current year and previous year's Annualized Percentage Net Change are calculated.
Global Markets — The chart displays the ranked current and previous year's performance of various ETFs representing Equities, Fixed Income, and Real Estate (requires the NYSE American enablement).
Commodities — The chart displays the ranked current and previous year's performance of 21 commodities (requires COMEX on Globex, CME on Globex, CBOT on Globex, London Metals Exchange, ICE Futures US Softs, and LME Select enablements).
S&P Sectors — The chart displays the ranked current and previous year's performance of the eleven S&P Sectors (requires the NYSE American enablement).
Magnificent Seven — The chart displays the ranked current and previous year's performance of Apple Inc., Amazon.com Inc., Alphabet, Inc. Class C, Meta Platforms, Inc., Microsoft Corporation, NVIDIA Corporation, and Tesla Inc (requires the NASDAQ enablement).
FOREX — The chart displays the ranked current and previous year's performance of the Dollar Index, the six currencies used to settle the Dollar Index and Bitcoin (requires ICE Futures US Financials and CME on Globex enablements).
Fixed Income — The chart displays the ranked current year's and previous year's performance of fixed income futures markets (requires the Eurex, Osaka Exchange, CBOT on Globex, and ICE Futures Europe Financials enablements).
At the bottom of each tab was the current session's market performance dashboard of the contracts for this particular group.
The number of contracts displayed on each tab ranged from 9 to 21.
An additional view may be helpful of just the top five contracts from each tab. The VSTACK function is useful for this process. The compiled view could be created on an additional tab on the original spreadsheet or in a new spreadsheet.
Starting with a new spreadsheet enter the VSTACK function in a cell, select the first six rows from a tab from the Market Performance Dashboard, enter a comma, and repeat this for all six tabs. Here is the result.
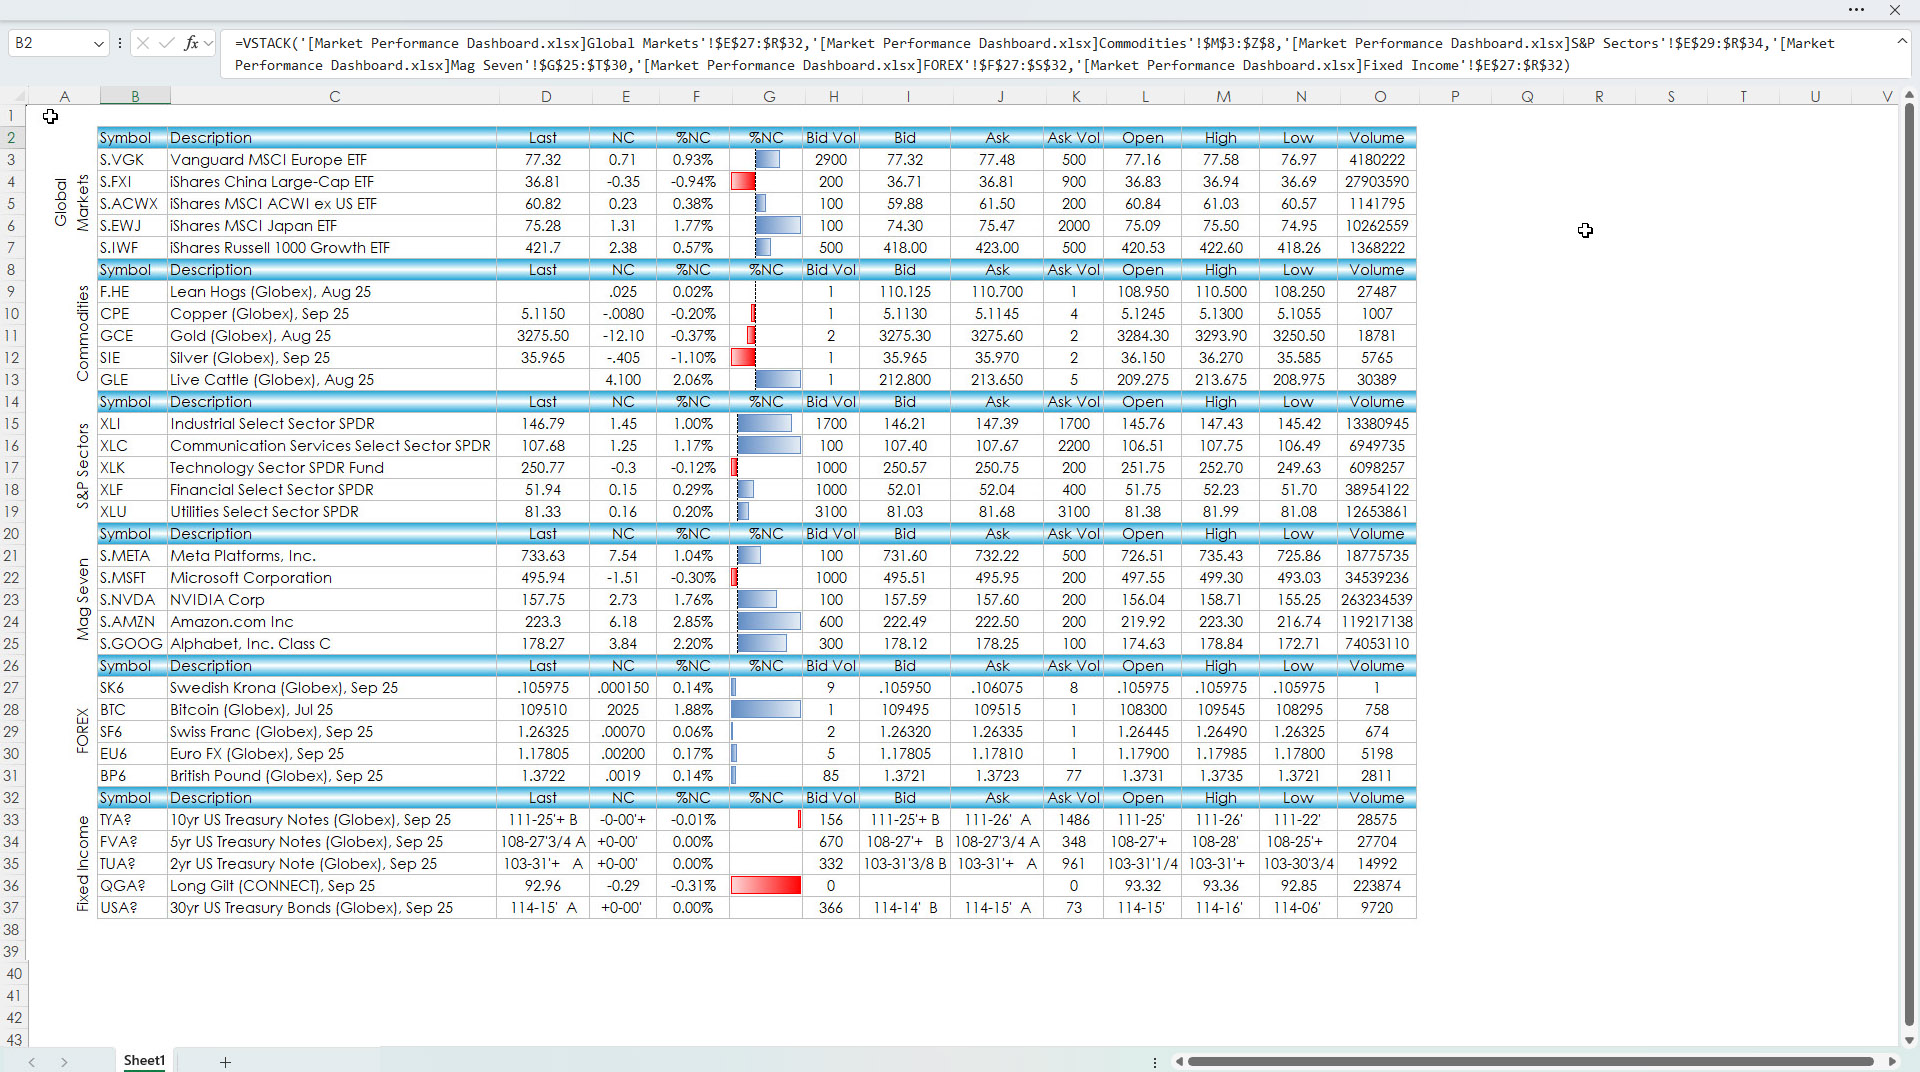
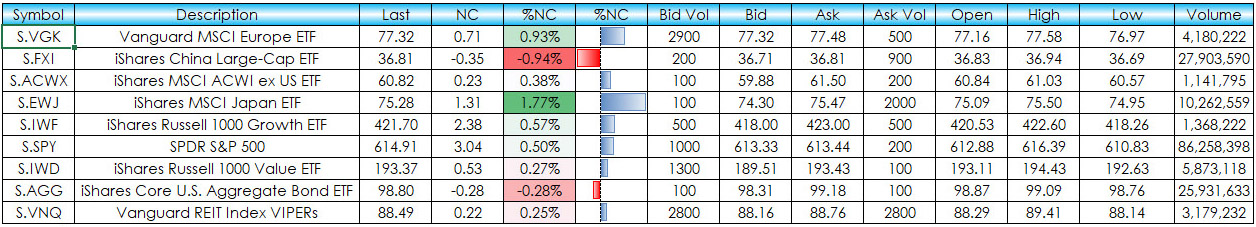
After formatting the displays there is a compiled display of the top five performers.
Both Excel dashboards are available below. Changing symbols is done on the first tab of the Market Performance Dashboard. Both dashboards must be open.
Requirements: CQG Integrated Client or QTrader, and Excel 365 (locally installed, not in the Cloud) or more recent.