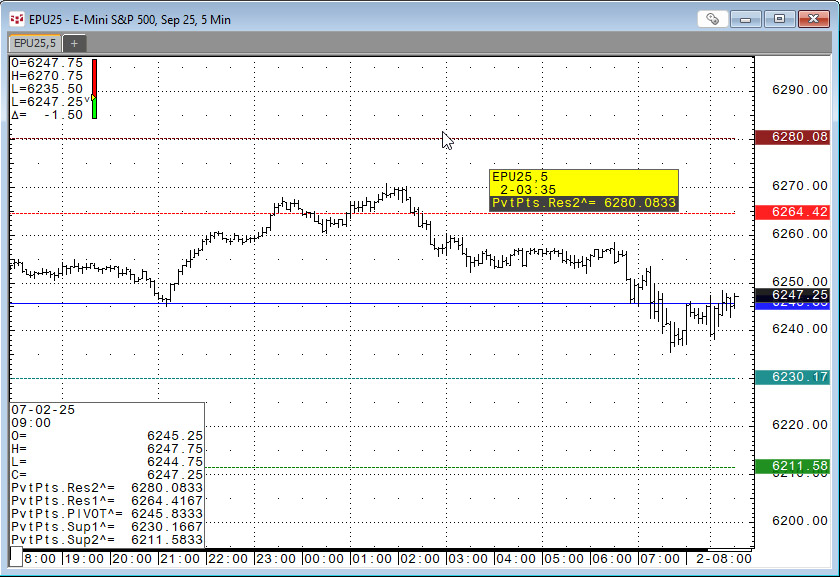
This post details bringing in the Pivot Points study values from IC or QTrader into Excel.
The pivot point is the arithmetic average of the high (H), low (L), and closing (C) prices of the active instrument, Pivot Point = (H+L+C)/3 or Pivot Point = HLC3. The study applied to a chart displays five curves:
- The pivot points.
- Two projected Resistance Levels.
- Two projected Support Levels.
The calculations use previous daily bar values and are used on the current session's intraday bars.
The image below is an example.
The formulas for the curves:
    Res2: (HLC3(@),D)[-1] + (Range(@),D)[-1]

    Res1: (2 * (HLC3(@),D)[-1]) - (Low(@),D)[-1]

    PIVOT: (HLC3(@),D)[-1]

    Sup1: (2 * (HLC3(@),D)[-1]) - (High(@),D)[-1]

    Sup2: (HLC3(@),D)[-1] - (Range(@),D)[-1]
More details and a downloadable CQG PAC is posted here: "CQG Primer Pivot Points".
The formulas for the curves using RTD functions in Excel and the symbol CLE?1:
    Res2: = RTD("cqg.rtd",,"StudyData","CLE?1", "PvtPts^",, "Res2","D",,"all",,,,"T")

    Res1: = RTD("cqg.rtd",,"StudyData","CLE?1", "PvtPts^",, "Res1","D",,"all",,,,"T")

    PIVOT: = RTD("cqg.rtd",,"StudyData","CLE?1", "PvtPts^",, "PIVOT","D",,"all",,,,"T")

    Sup1: = RTD("cqg.rtd",,"StudyData","CLE?1", "PvtPts^",, "Sup1","D",,"all",,,,"T")

    Sup2: = RTD("cqg.rtd",,"StudyData","CLE?1", "PvtPts^",, "Sup2","D",,"all",,,,"T")
The downloadable Excel sample uses these RTD formulas for a collection of symbols.
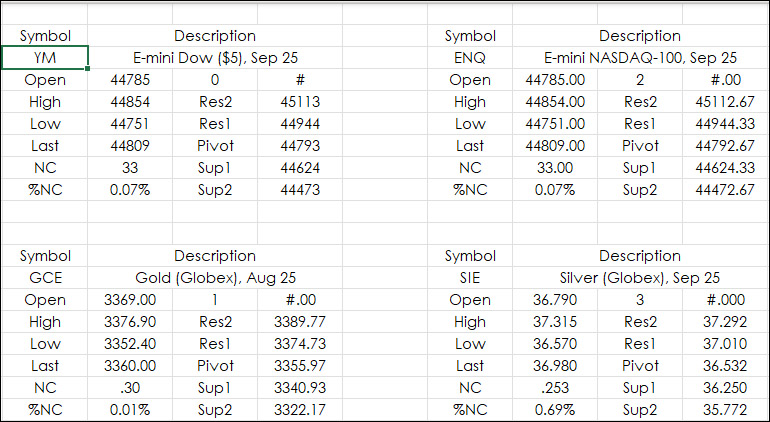
For each block you see the O, H, L, and Last, plus Net Change and Percentage Net Change. The Pivot Points are displayed in the next column over. This dashboard accepts symbols and the data is formatted for the correct number of decimals. Next to the Open price is the tick size as an integer and next to that is parameters for formatting the price using Excel's TEXT function.
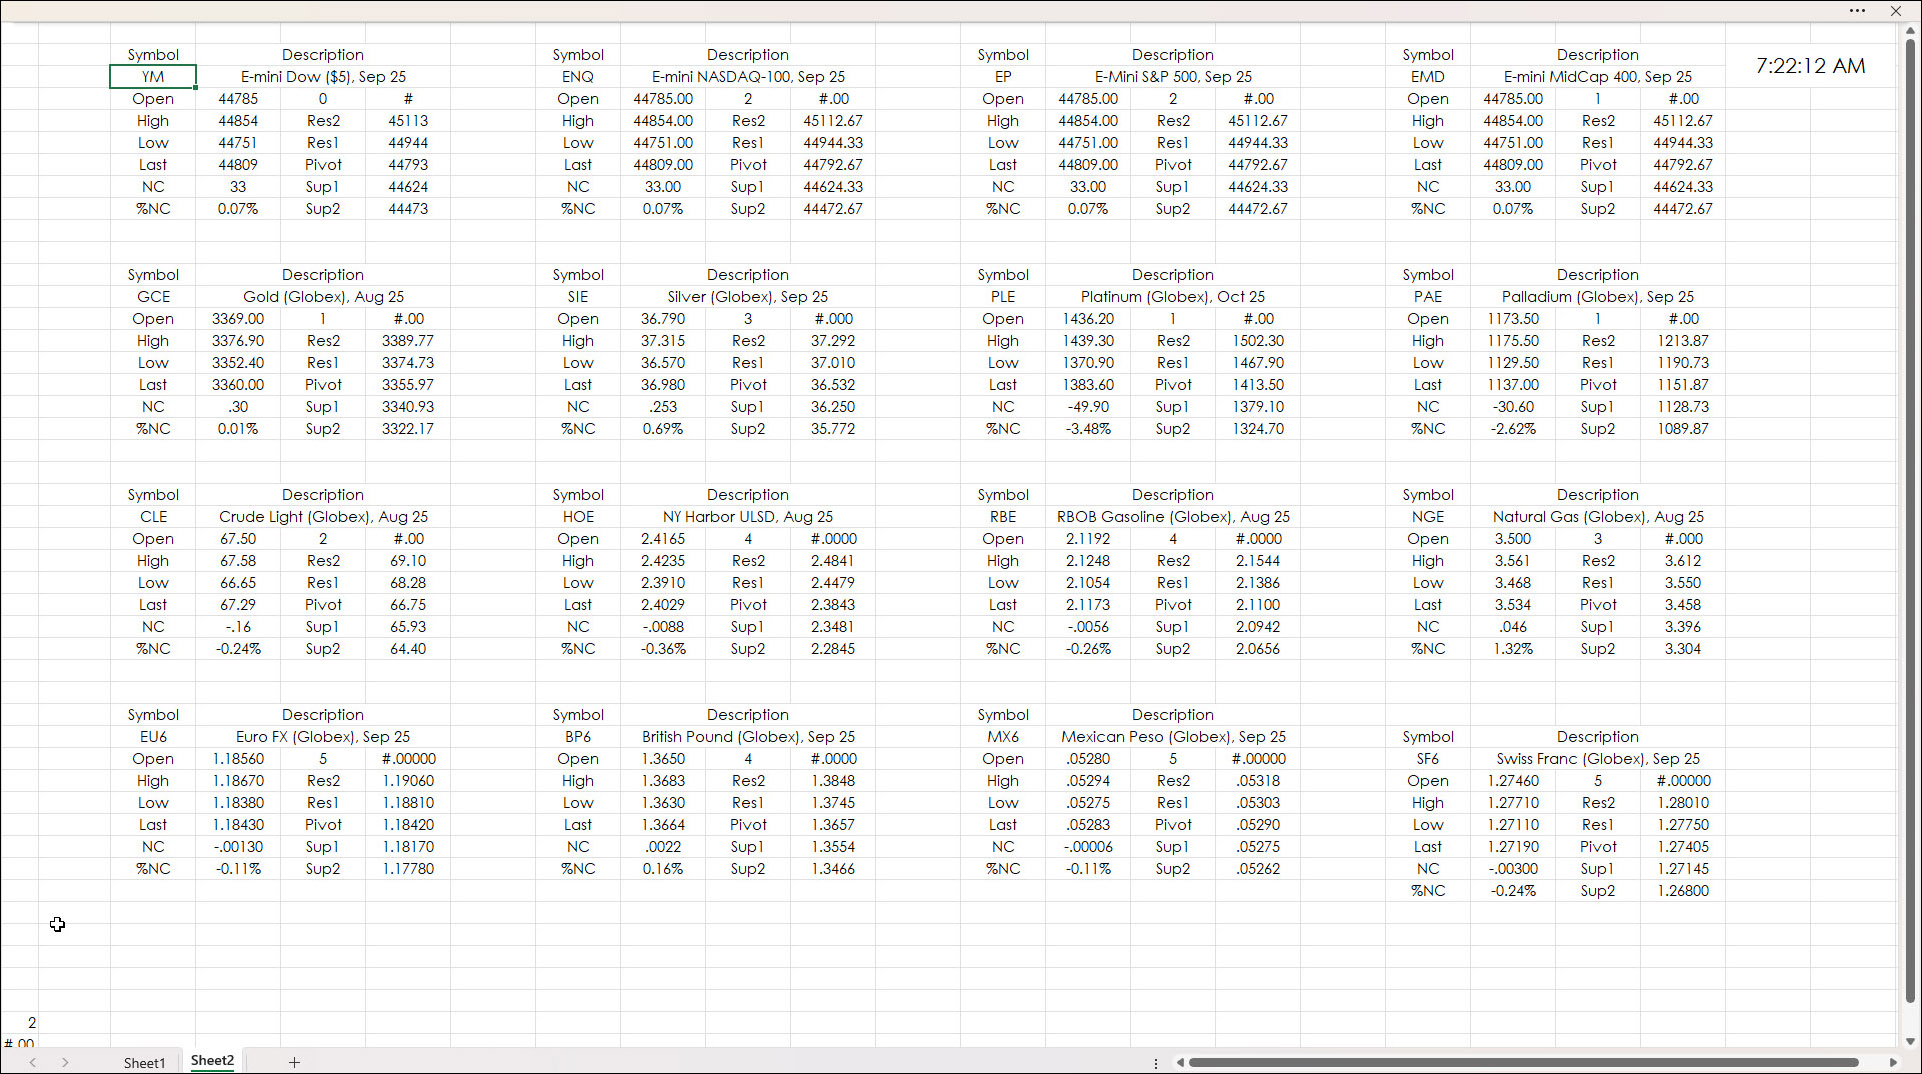
Above is the full image of the downloadable sample. The symbols can be changed. Use all capital letters.
Requirements: CQG Integrated Client or QTrader, and Excel 2016 (locally installed, not in the Cloud) or more recent.