This post details how to use Excel’s Index and Matching function to extract data from a table. The example (downloadable sample at the bottom of the post) uses the 30 stocks in the DJIA as a starting point.
The table is pulling in from the symbol column the description, last, net change, daily percentage net change and the ranked performance, weekly percentage net change and the ranked performance, monthly percentage net change and the ranked performance and finally, the annual percentage net change and the ranked performance.
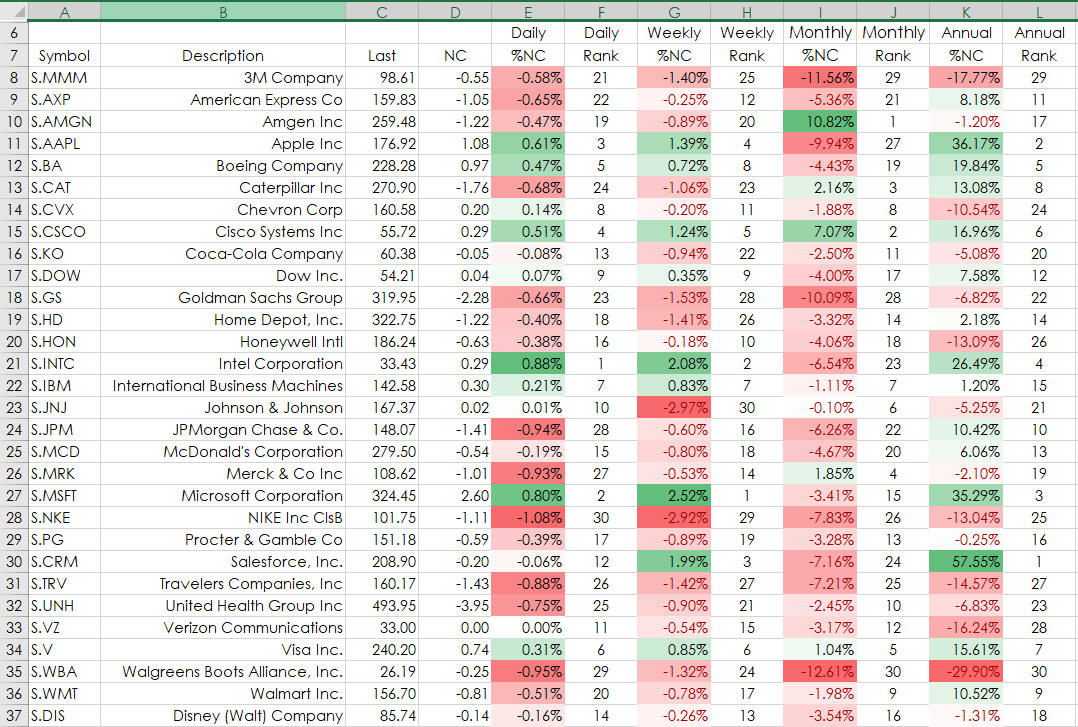
Here are the RTD and Excel formulas by column beginning with the symbol in cell A8 and copied down.
Description:
=RTD("cqg.rtd", ,"ContractData",A8, "LongDescription",, "T")
Last:
=RTD("cqg.rtd", ,"ContractData",A8, "LastTradeToday",, "T")
Net Change:
=IF(C8="","",RTD("cqg.rtd", ,"ContractData",A8, "NetLastQuoteToday",, "T"))
Daily Percentage Net Change:
=IFERROR(RTD("cqg.rtd", ,"ContractData",A8, "PerCentNetLastTrade",, "T")/100,"")
Ranked performance (the CountIf function is used to remove ties):
=IFERROR(RANK(E8,$E$8:$E$37,0)+COUNTIF($E$8:E8,E8)-1,"")
Weekly Percentage Net Change (the Percent Bar RTD formula is used):
=IFERROR( RTD("cqg.rtd",,"StudyData",A8, "PCB","BaseType=Index,Index=1", "Close", "W",,"All",,,,"T")/100,"")
Ranked Performance:
=IFERROR(RANK(G8,$G$8:$G$37,0)+COUNTIF($G$8:G8,G8)-1,"")
Monthly Percentage Net Change:
= IFERROR(RTD("cqg.rtd",,"StudyData",A8, "PCB","BaseType=Index,Index=1", "Close", "M",,"All",,,,"T")/100,"")
Ranked Performance:
=IFERROR(RANK(I8,$I$8:$I$37,0)+COUNTIF($I$8:I8,I8)-1,"")
Annual Percentage Net Change:
=IFERROR( RTD("cqg.rtd",,"StudyData",A8, "PCB","BaseType=Index,Index=1", "Close", "A",,"All",,,,"T")/100,"")
Ranked Performance:
=IFERROR(RANK(K8,$K$8:$K$37,0)+COUNTIF($K$8:K8,K8)-1,"")
Excel’s IFERROR function is used to have a cleaner look when market data has been removed prior to the open of a new session.
Index and Match
These two functions are used to extract performance data by symbol from a drop-down list in cell A3. The data is the same data from cell E8 through L37 only narrowed down to one symbol’s data making it easier for the user.
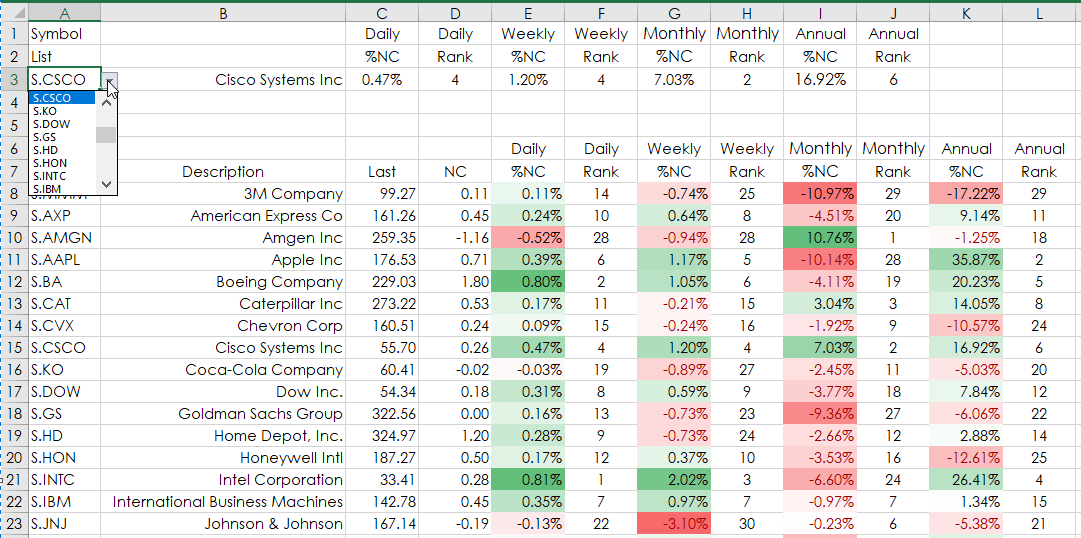
Here is the Excel formula in cell C3:
{=INDEX(E8:L37,MATCH(A3,A8:A37,0),MATCH(C1&C2,E6:L6&E7:L7,0))}
The Index function returns the value of a cell in a table or an array, selected by the row and column number indexes as parameters in the function. For the parameters the Match Function is used.
Here, the Index Function is reviewing the table marked by cells E8 through L37 for the symbol in cell A3, in this case “CSCO.” The row number is found by where the data in cell A3 (the Match) is in cells A8 through A37. The column is the Match of cells C1&C2 in the cells E6:L6&E7:L7. The 0 in the two Match function requires a perfect match.
Notice in the Excel function above the two { } brackets used. This is entered as an array because the Match for the columns are using two cells, C1 & C2 (Daily & %NC) looked for in cells E6:L6 & E7:L7.
To enter the formula as an array you type in the formula and then hit the key combination Ctrl+Shft+Enter.
The Daily Rank data for CSCO is in cell D3:
{=INDEX(E8:L37,MATCH(A3,A8:A37,0),MATCH(D1&D2,E6:L6&E7:L7,0))}
Again, after you type in the formula then hit the key combination Ctrl+Shft+Enter.
The remaining columns use the same functions with the appropriate cell references for the columns.
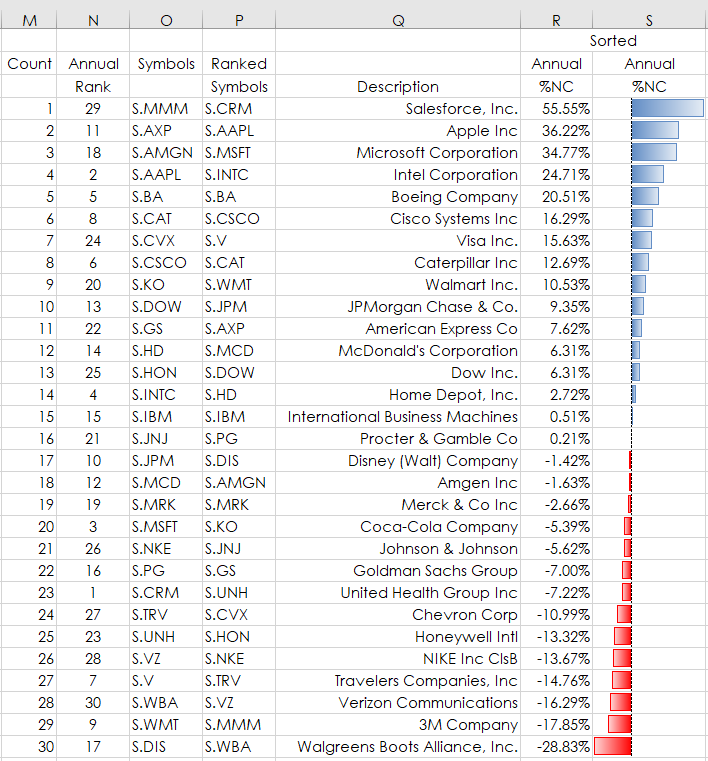
An additional feature in spreadsheet is the 30 symbols annual performance is determined, ranked and sorted using cell M5 through S37.
The sample spreadsheet is open for easy modification.
Requirements: CQG Integrated Client or QTrader, and Excel 2010 or more recent.