The Sharpe ratio measures the performance of an investment such as a security or portfolio compared to a risk-free asset, after adjusting for its risk. It is the difference between the returns of the investment and the risk-free return, divided by the standard deviation of the investment returns. The Sharpe ratio represents the additional amount of return that an investor receives per unit of increase in risk.
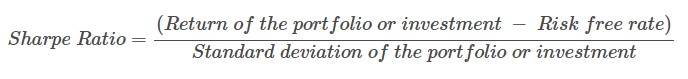
Where:
The Return of the portfolio or investment is the average return by the investment over a specific period.
The Risk-free rate is the return on an investment that is considered to have no risk, such as government securities, i.e., U.S. Treasury Bills.
The Standard deviation is a statistical measure of the volatility of the investment.
This post details the calculation of the Sharpe Ratio using Excel. The source is QuantInsti.com.
The sample downloadable spreadsheet has four markets for 2024 (MSFT, AMZN, NVDA, and BTC).
The data was brought into Excel by copying and pasting from a chart using the Tabular display for 1/2/2024 to 12/31/2024.
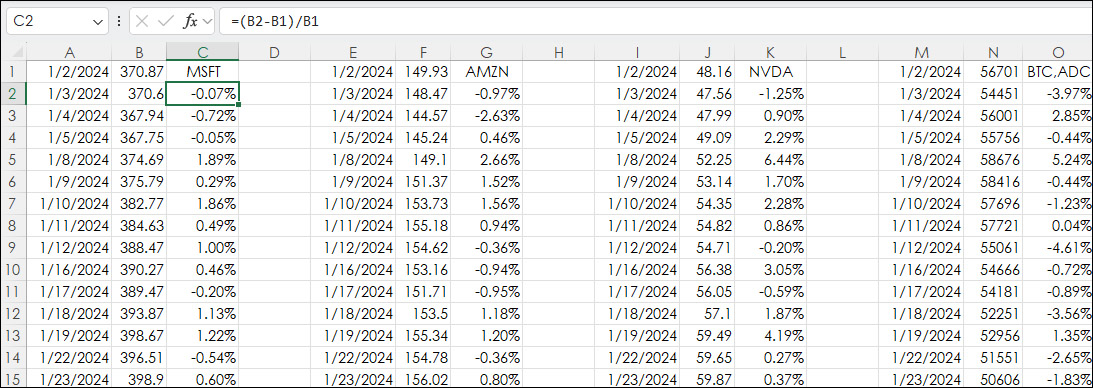
Column C, G, K, and O calculate the daily percent changes:
Column C: =(B2-B1)/B1
Column G: =(F2-F1)/F1
Column K: =(J2-J1)/J1
Column O: =(N2-N1)/N1
For Microsoft, the Sharpe Ratio uses the Average returns from column C multiplied by 251.
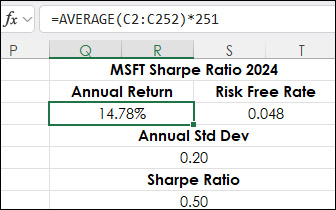
The Risk Free rate (0.048) was the 1-year T-bill rate on 1/2/2024. This was pulled from the website FRED (Federal Reserve Economic Data) maintained by the Federal Reserve Bank of St. Louis. The link to the data series is here.
The Annualized Standard Deviation is in cell Q5:
=STDEV.P(C2:C251)*251^0.5
The Sharpe Ratio is calculated in cell Q7:
=(Q3-S3)/Q5
Here is a matrix view of all four Sharpe Ratios.
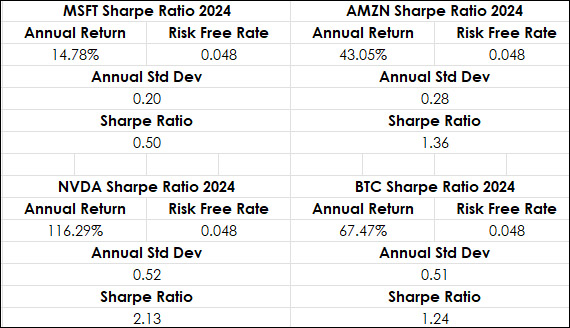
Above, NVDA has the highest Sharpe Ratio, but it also has the highest standard deviation. Amazon has the second highest Sharpe Ratio, but the third lowest standard deviation. Margin was not considered for Bitcoin.
This link is to an overview video into more insights of the Sharp Ratio.
Requires CQG Integrated Client or CQG QTrader, and Excel 2016 or more recent.