This post details a CQG PAC that can be downloaded and installed to track the day's performance of the holdings of the iShares U.S. Aerospace & Defense ETF (Symbol: ITA)
From the iShares website regarding the objective of the ITA: "The iShares U.S. Aerospace & Defense ETF seeks to track the investment results of an index composed of U.S. equities in the aerospace and defense sector."
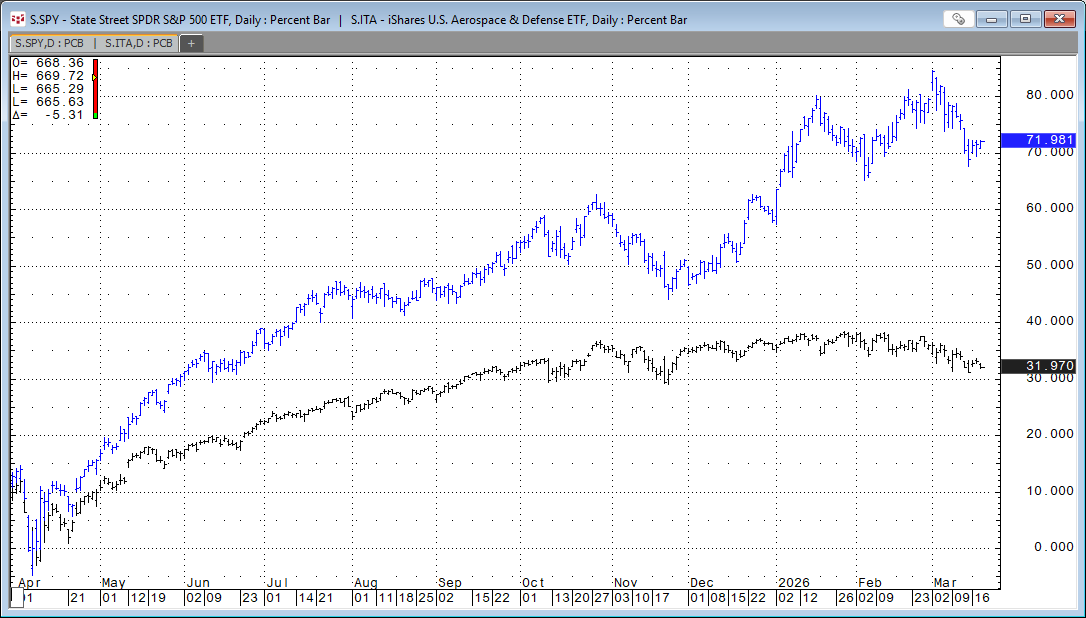
The image below compares the price performance of the ITA ETF (blue) to the SPY ETF (black) since the April lows of 2025.
Here is a list of the current top ten holdings:
| Symbol | Company | % Assets |
|---|---|---|
| GE | GE Aerospace | 20.99% |
| RTX | RTX Corporation | 15.79% |
| BA | The Boeing Company | 7.55% |
| LMT | Lockheed Martin Corporation | 5.26% |
| HWM | Howmet Aerospace Inc. | 5.13% |
| NOC | Northrop Grumman Corporation | 4.90% |
| LHX | L3Harris Technologies, Inc. | 4.79% |
| GD | General Dynamics Corporation | 3.92% |
| TDG | TransDigm Group Incorporated | 3.76% |
| AXON | Axon Enterprise, Inc. | 3.48% |
This table details the top ten performers through 3/13/2026.
| Symbol | Company | Performance |
|---|---|---|
| S.US.RCAT | Red Cat Holdings Cmn | 100.00% |
| S.US.SWBI | Smith & Wesson Brand | 39.82% |
| S.US.KRMN | Karman Holdings Inc. | 36.64% |
| S.US.LMT | Lockheed Martin Corp | 33.56% |
| S.US.DRS | Leonardo Drs, Inc Cm | 32.88% |
| S.US.DCO | Ducommun Inc | 31.56% |
| S.US.NOC | Northrop Grumman Corporation | 28.67% |
| S.US.MOGA | Moog Inc Clsa | 23.83% |
| S.US.ATI | Ati Inc. | 23.71% |
| S.US.NPK | National Presto Industries Inc. | 23.25% |
This table details the bottom ten performers through 3/13/2026.
| Symbol | Company | Performance |
|---|---|---|
| S.US.BA | Boeing Company | -3.33% |
| S.US.LOAR | Loar Holdings Inc. | -4.90% |
| S.US.TDG | Transdigm Group | -8.66% |
| S.US.SARO | Standardaero, Inc. | -9.14% |
| S.US.HEI | Heico Corp | -10.86% |
| S.US.HEIA | Heico Corp Cla | -12.30% |
| S.US.AXON | Axon Enterprise, Inc | -12.63% |
| S.US.AVAV | Aerovironment, Inc. | -14.39% |
| S.US.ACHR | Archer Aviation Inc | -19.81% |
| S.US.CDRE | Cadre Holdings, Inc. | -22.50% |
Below is an image of the page installed from the downloadable CQG PAC.
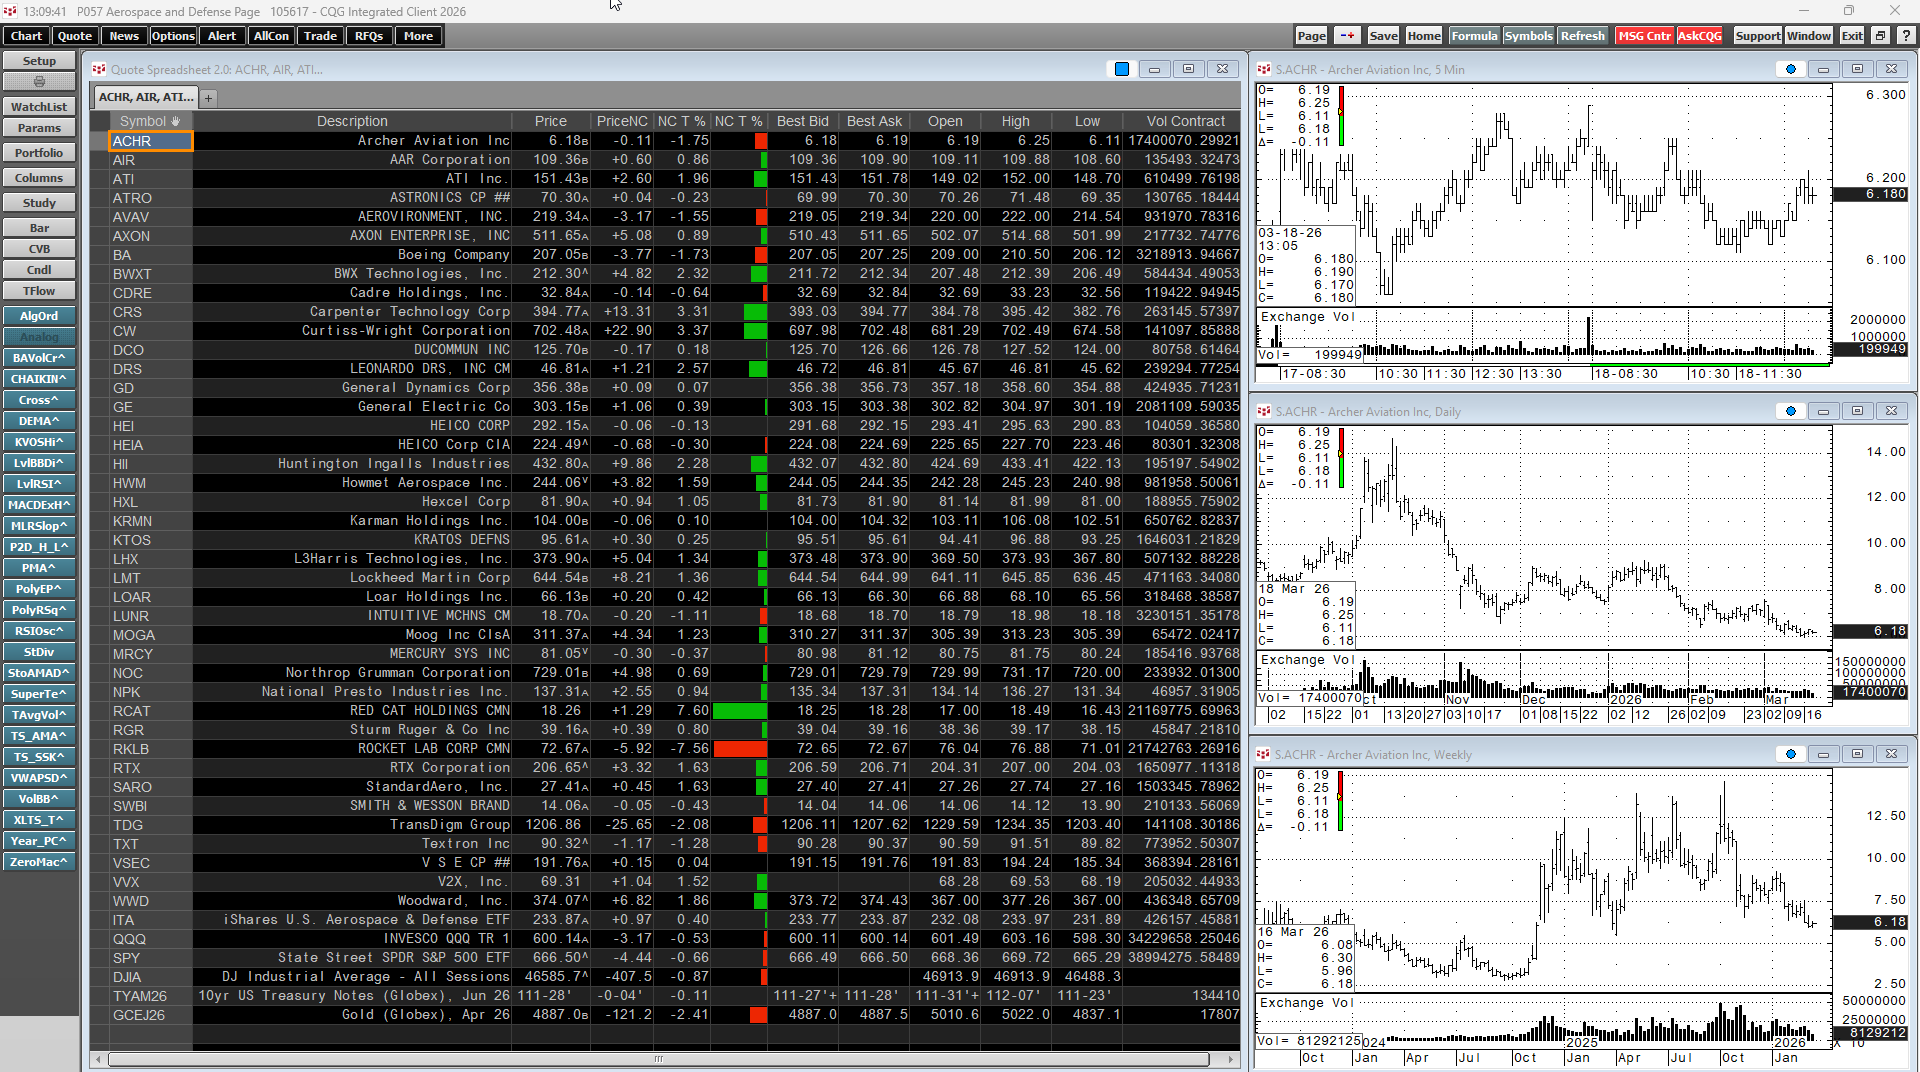
The current holdings are as of 3/13/2026. The QuoteSpreadsheet V2 is linked to the three charts. Clicking on any symbol will change the symbols in the charts. The chart time frames are 5-minute, daily, and weekly.
Requires CQG Integrated Client or CQG QTrader, data enablements for the NYSE and Nasdaq.