
The S&P North American Natural Resources Sector Index is a financial benchmark that measures the performance of U.S. and Canadian publicly traded companies operating within the natural resources and commodities sectors. This post details a downloadable Microsoft Excel dashboard that tracks the current sessions performance of the holdings of the iShares North American Natural Resources ETF.
From the website: "The iShares North American Natural Resources ETF seeks to track an index that includes North American equities in the natural resources sector. The fund offers a way to gain targeted exposure to energy, mining, and forestry companies."
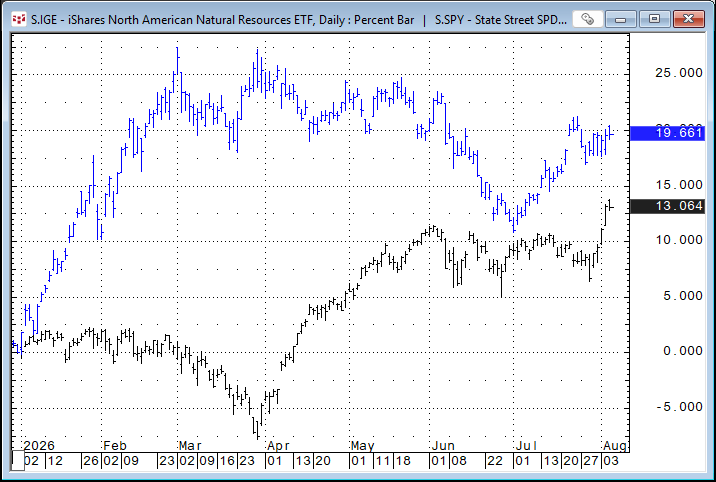
The image below shows the current year performance of IGE (blue) versus the SPY (black).
Top Ten Holdings (8/4/2026)
| Symbol | Company | Sector | Weight (%) |
|---|---|---|---|
| S.XOM | ExxonMobil Holdings Corporation | Energy | 9.99 |
| S.CVX | Chevron Corp | Energy | 9.47 |
| S.COP | ConocoPhillips | Energy | 3.82 |
| S.ENB | Enbridge Inc | Energy | 3.10 |
| S.NEM | Newmont Goldcorp Corporation | Materials | 2.77 |
| S.FCX | Freeport-McMoRan Inc. | Materials | 2.57 |
| S.CNQ | Canadian Natural Resources Limited | Energy | 2.56 |
| S.VLO | Valero Energy Corp New | Energy | 2.43 |
| S.MPC | Marathon Petroleum Corporation | Energy | 2.42 |
| S.WMB | Williams Companies Inc | Energy | 2.32 |
Top Ten Percentage Gains as of 8/4/2026
| Rank | Symbol | % Change | Company |
|---|---|---|---|
| 1 | S.US.MTRN | 138.68% | Materion Corporation |
| 2 | S.US.PBF | 130.27% | PBF Energy Inc |
| 3 | S.US.PARR | 107.60% | Par Pacific Holdings Inc. |
| 4 | S.US.DK | 105.16% | Delek US Holdings Inc |
| 5 | S.US.CLMT | 104.33% | CALUMET, INC COMM ST |
| 6 | S.US.OII | 102.37% | Oceaneering Internatl Inc |
| 7 | S.US.VLO | 87.17% | Valero Energy Corp New |
| 8 | S.US.INSW | 87.06% | International Seaways, Inc. |
| 9 | S.US.MPC | 86.12% | Marathon Petroleum Corporation |
| 10 | S.US.DINO | 83.40% | HF Sinclair Corporation |
Bottom Ten Percentage Gains as of 8/4/2026
| Rank | Symbol | % Change | Company |
|---|---|---|---|
| 140 | S.US.AGI | -19.47% | Alamos Gold Inc |
| 141 | S.US.CRH | -20.08% | CRH Public Limited Company |
| 142 | S.US.GPK | -21.45% | Graphic Packaging Holding Company |
| 143 | S.US.LEU | -21.70% | Centrus Energy Corp. |
| 144 | S.US.BTU | -22.96% | Peabody Energy |
| 145 | S.US.GPOR | -24.63% | GPOR |
| 146 | S.US.NG | -26.39% | NovaGold Resources Inc |
| 147 | S.US.EQX | -26.85% | Equinox Gold Corp. |
| 148 | S.US.CRK | -43.18% | Comstock Resources Inc |
| 149 | S.US.OI | -48.71% | Owens-Illinois Inc |
Below is an image of the downloadable Excel Dashboard. During the trading session, the Excel dashboard dynamically ranks the individual stocks held by IGE.
The Excel dashboard shows the top fifteen positive and bottom fifteen negative performers as histogram bar charts, along with their respective net percent change for today's trading session.
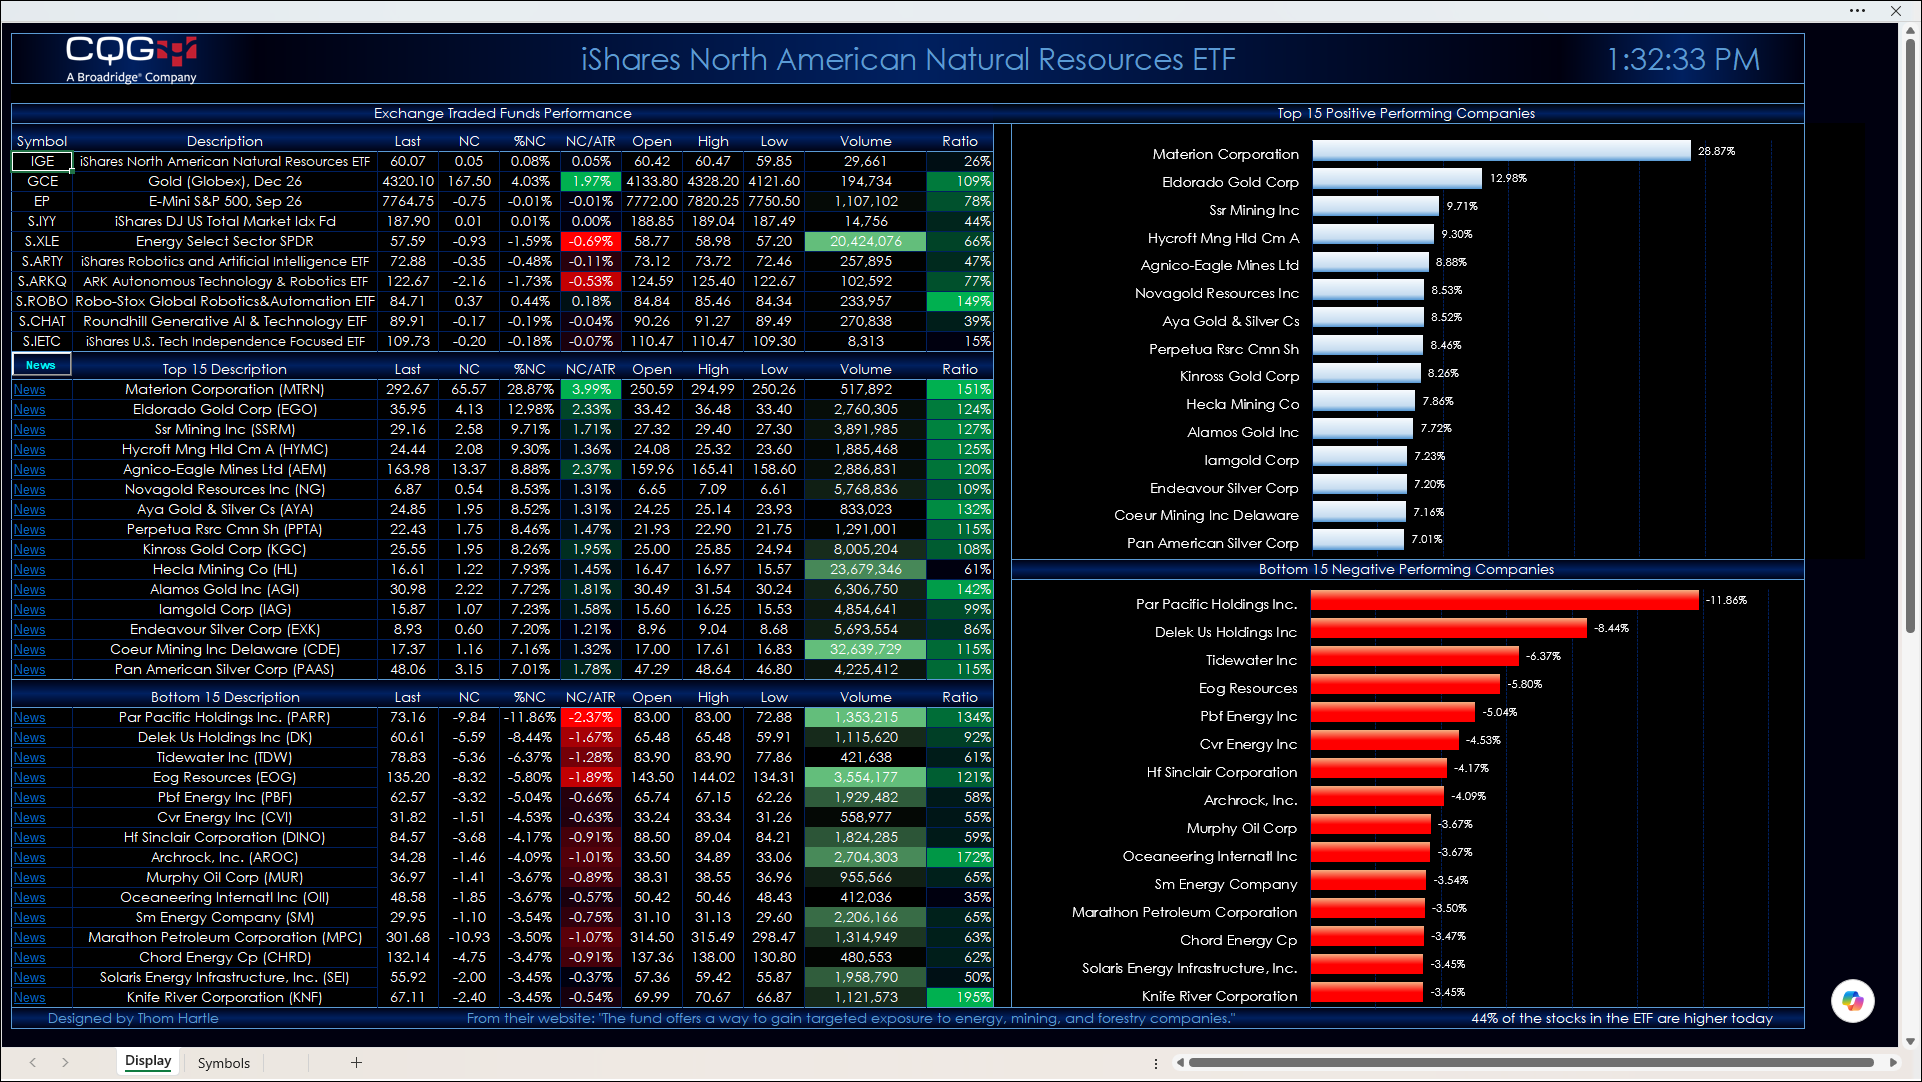
The top section of the quote display allows you to enter your own symbols.
The second section displays the top fifteen performers. The third section displays the bottom fifteen performers.
Quote data includes today's net change as a ratio to the 21-day Average True Range study. Next to today's traded volume is a column that calculates the ratio of today's volume versus the 21-day average of the volume. This ratio column gives you a sense of how active today's trading is relative to recent history. Readings of 100% and higher indicate active trading.
A key feature next to each company name is a link to Yahoo Finance. Clicking the News link will take you to the Yahoo page for that symbol. Note that this could take approximately 30 seconds to open in a browser. Turning off Extensions in your browser will make this happen faster.
If you open another Excel spreadsheet, then this dashboard will no longer be the active spreadsheet. The macro that updates the links and ranks the stocks by performance will stop. To start the macro, simply click the News toolbar button in the first column.
The current holdings are as of 4/24/2026. There is a Symbols tab with instructions detailing where to download the latest posted spreadsheet with the current holdings and steps to update the dashboard.
Make sure to lower your Excel Realtime Data (RTD) throttle to 100 milliseconds. Learn how to do that here.
Requires CQG Integrated Client or CQG QTrader, data enablements for the NYSE and Nasdaq.