This post details a CQG PAC that is a CQG page that can be downloaded and installed to track the day's performance of the holdings of the Schwab U.S. Dividend Equity ETF (Symbol: SCHD).
From Schwab's website:
Objective
The fund's goal is to track as closely as possible, before fees and expenses, the total return of the Dow Jones U.S. Dividend 100™ Index.
Highlights
- A straightforward, low-cost fund offering potential tax-efficiency
- The fund can serve as part of the core or complement in a diversified portfolio
- Tracks an index focused on the quality and sustainability of dividends
- Invests in stocks selected for fundamental strength relative to their peers, based on financial ratios
The ETF has 100 companies. The image below compares the price performance of the ITA ETF (blue) to the SPY ETF (black) since the start of 2026.
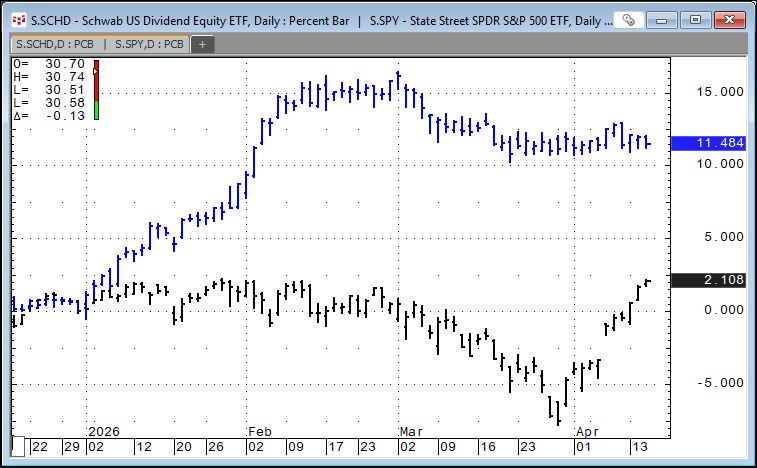
To date, the SCHD ETF has outperformed the SPY ETF.
Here is a list of the current top ten holdings:
| Symbol | Name | Percent of Assets (%) |
|---|---|---|
| S.US.TXN | Texas Instruments | 4.47% |
| S.US.UNH | United Health Group Inc | 4.44% |
| S.US.CVX | Chevron Corp | 4.15% |
| S.US.MRK | Merck & Co Inc | 4.12% |
| S.US.KO | Coca-Cola Company | 4.01% |
| S.US.PEP | PepsiCo Inc | 3.92% |
| S.US.COP | ConocoPhillips | 3.87% |
| S.US.HD | Home Depot, Inc. | 3.83% |
| S.US.AMGN | Amgen | 3.82% |
| S.US.PG | Procter & Gamble Co | 3.77% |
This table details the top ten performers through 4/15/2026.
| Rank | Symbol | Name | % Gain |
|---|---|---|---|
| 1 | S.US.APA | APA Corporation | 49.75% |
| 2 | S.US.SLB | SLB NV | 35.41% |
| 3 | S.US.OXM | Oxford Industries Inc | 31.81% |
| 4 | S.US.CWENA | Clearway Energy, Inc. Class A | 27.91% |
| 5 | S.US.COP | ConocoPhillips | 26.93% |
| 6 | S.US.EOG | EOG Resources | 26.51% |
| 7 | S.US.LMT | Lockheed Martin Corp | 25.93% |
| 8 | S.US.DINO | HF Sinclair Corporation | 25.69% |
| 9 | S.US.TGT | Target Corp | 24.84% |
| 10 | S.US.DVN | Devon Energy Corp | 23.48% |
Below is an image of the page installed from the downloadable CQG PAC.
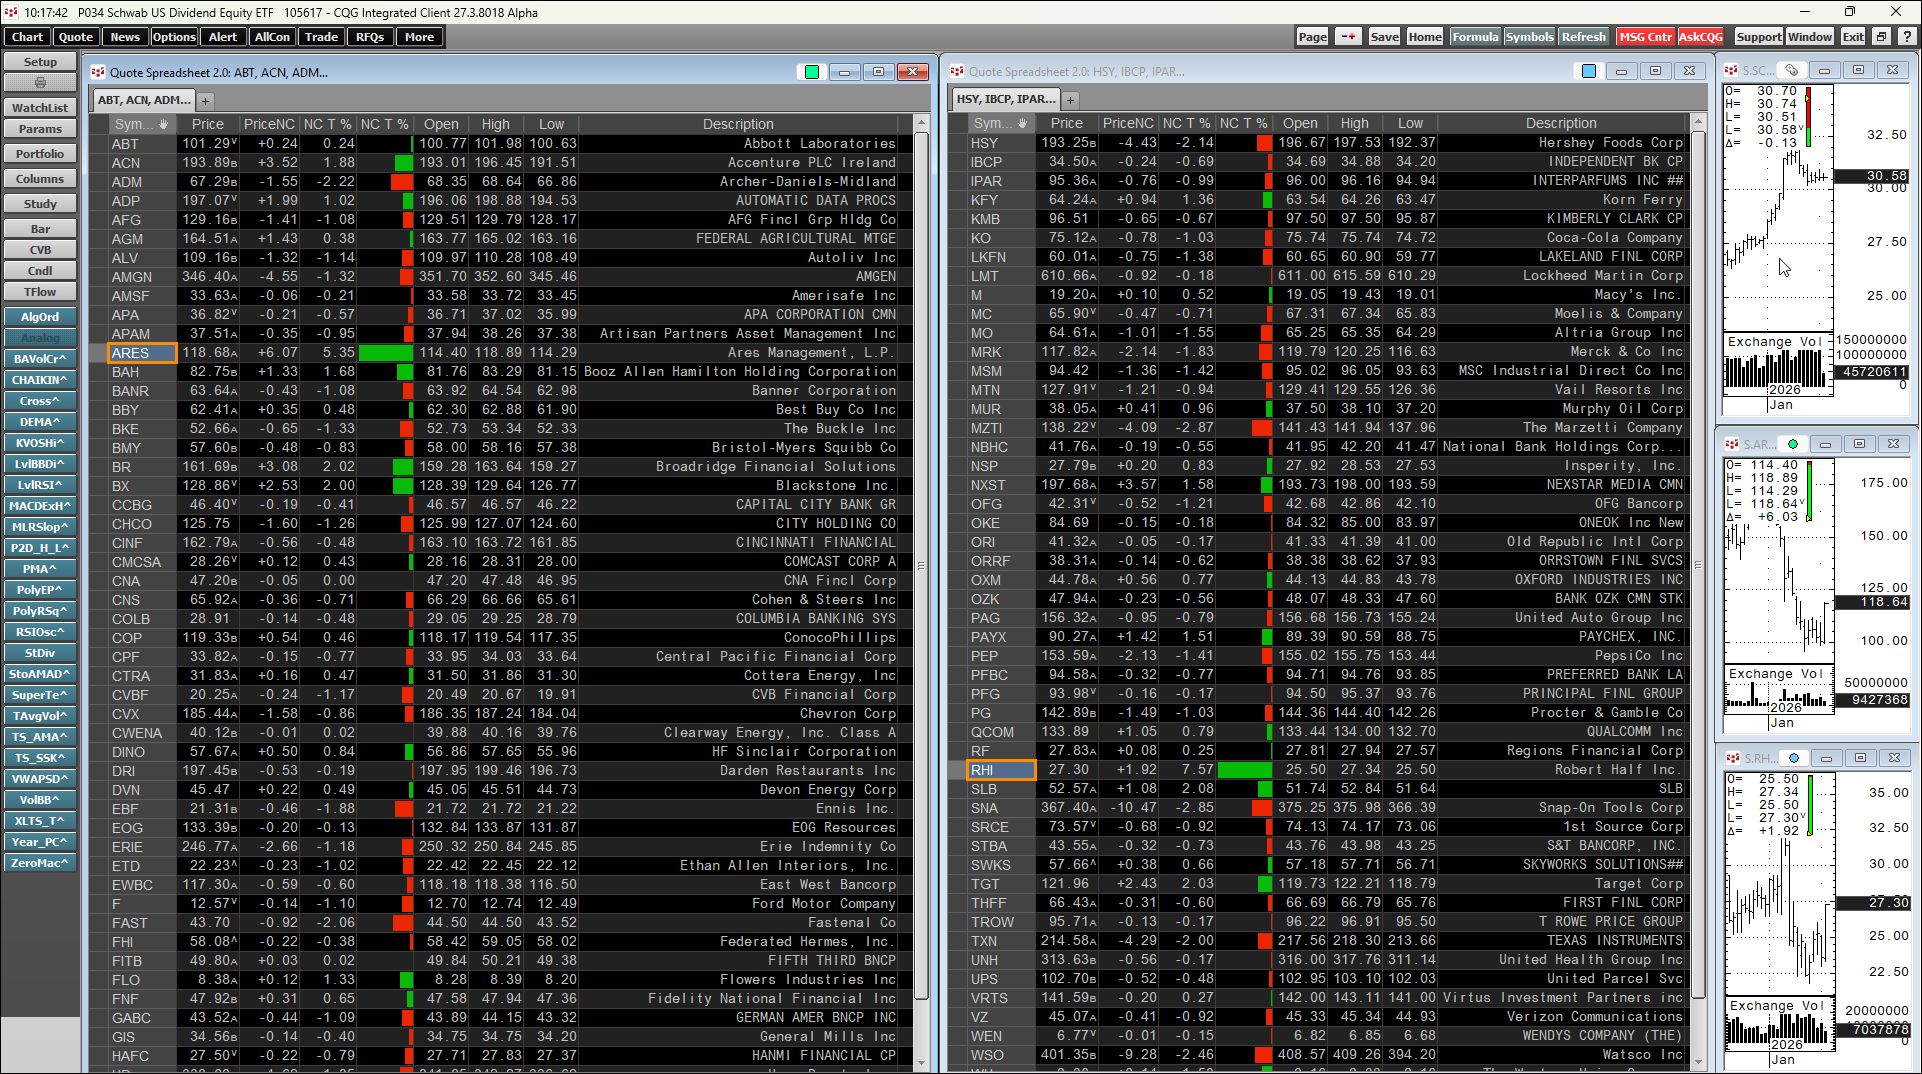
The current holdings are as of 3/13/2026. The QuoteSpreadsheet V2 is linked to the three charts. Clicking on any symbol will change the symbols in the charts. The chart time frames are weekly. SCHD is updated in March of each year.
Requires CQG Integrated Client or CQG QTrader, data enablements for the NYSE and Nasdaq exchanges.