This post details a CQG PAC that is a CQG page that can be downloaded and installed to track the day’s performance of the holdings of the SPDR® S&P® Metals & Mining ETF.
From The State Street website:
Seeks to provide exposure to the metals & mining segment of the S&P TMI, which comprises the following sub-industries: Aluminum, Coal & Consumable Fuels, Copper, Diversified Metals & Mining, Gold, Precious Metals & Minerals, Silver, and Steel.
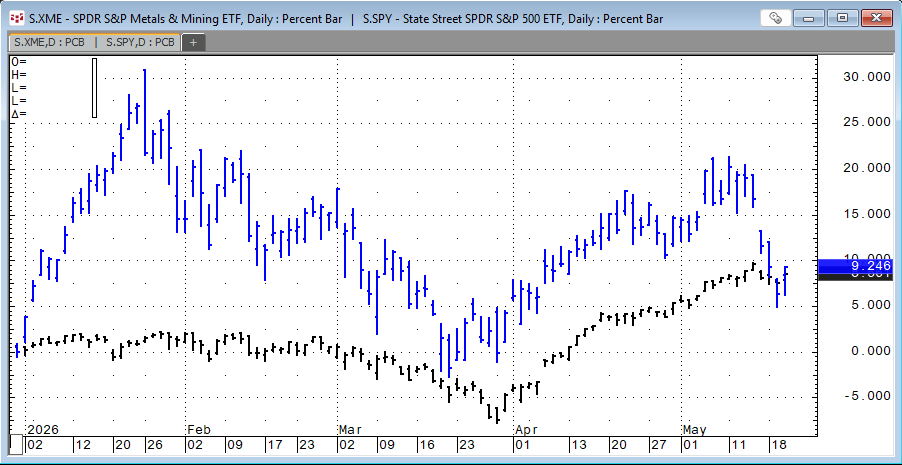
The ETF has 34 companies. The image below compares the price performance of the XME ETF (blue) to the SPY ETF (black) since the start of 2026.
Here is a list of the current top ten holdings (as of 5/20/2026):
| Symbol | Name | Assets (%) |
|---|---|---|
| S.NUE | Nucor Corp | 5.72% |
| S.STLD | Steel Dynamics Inc | 5.40% |
| S.RS | Reliance, Inc. | 5.12% |
| S.CLF | Cleveland-Cliffs Inc. | 4.85% |
| S.CMC | Commercial Metals Co | 4.66% |
| S.HCC | Warrior Met Coal, Inc. | 4.36% |
| S.FCX | Freeport-McMoRan Inc. | 4.31% |
| S.AA | ALCOA Inc. | 4.21% |
| S.NEM | Newmont Goldcorp Corp | 4.03% |
| S.USAR | USA RAR ERTH CL A CS | 4.01% |
This table details the top five performers through 5/20/2026.
| Rank | Symbol | Name | % Gain |
|---|---|---|---|
| 1 | S.USAR | USA RAR ERTH CL A CS | 98.57% |
| 2 | S.UAMY | United States Antimony Corporation | 68.92% |
| 3 | S.MTRN | Materion Corporation | 62.52% |
| 4 | S.CMP | Compass Minerals Intl | 49.85% |
| 5 | S.CENX | CENTURY ALUMINUM C## | 48.67% |
Below is an image of the page installed from the downloadable CQG PAC.
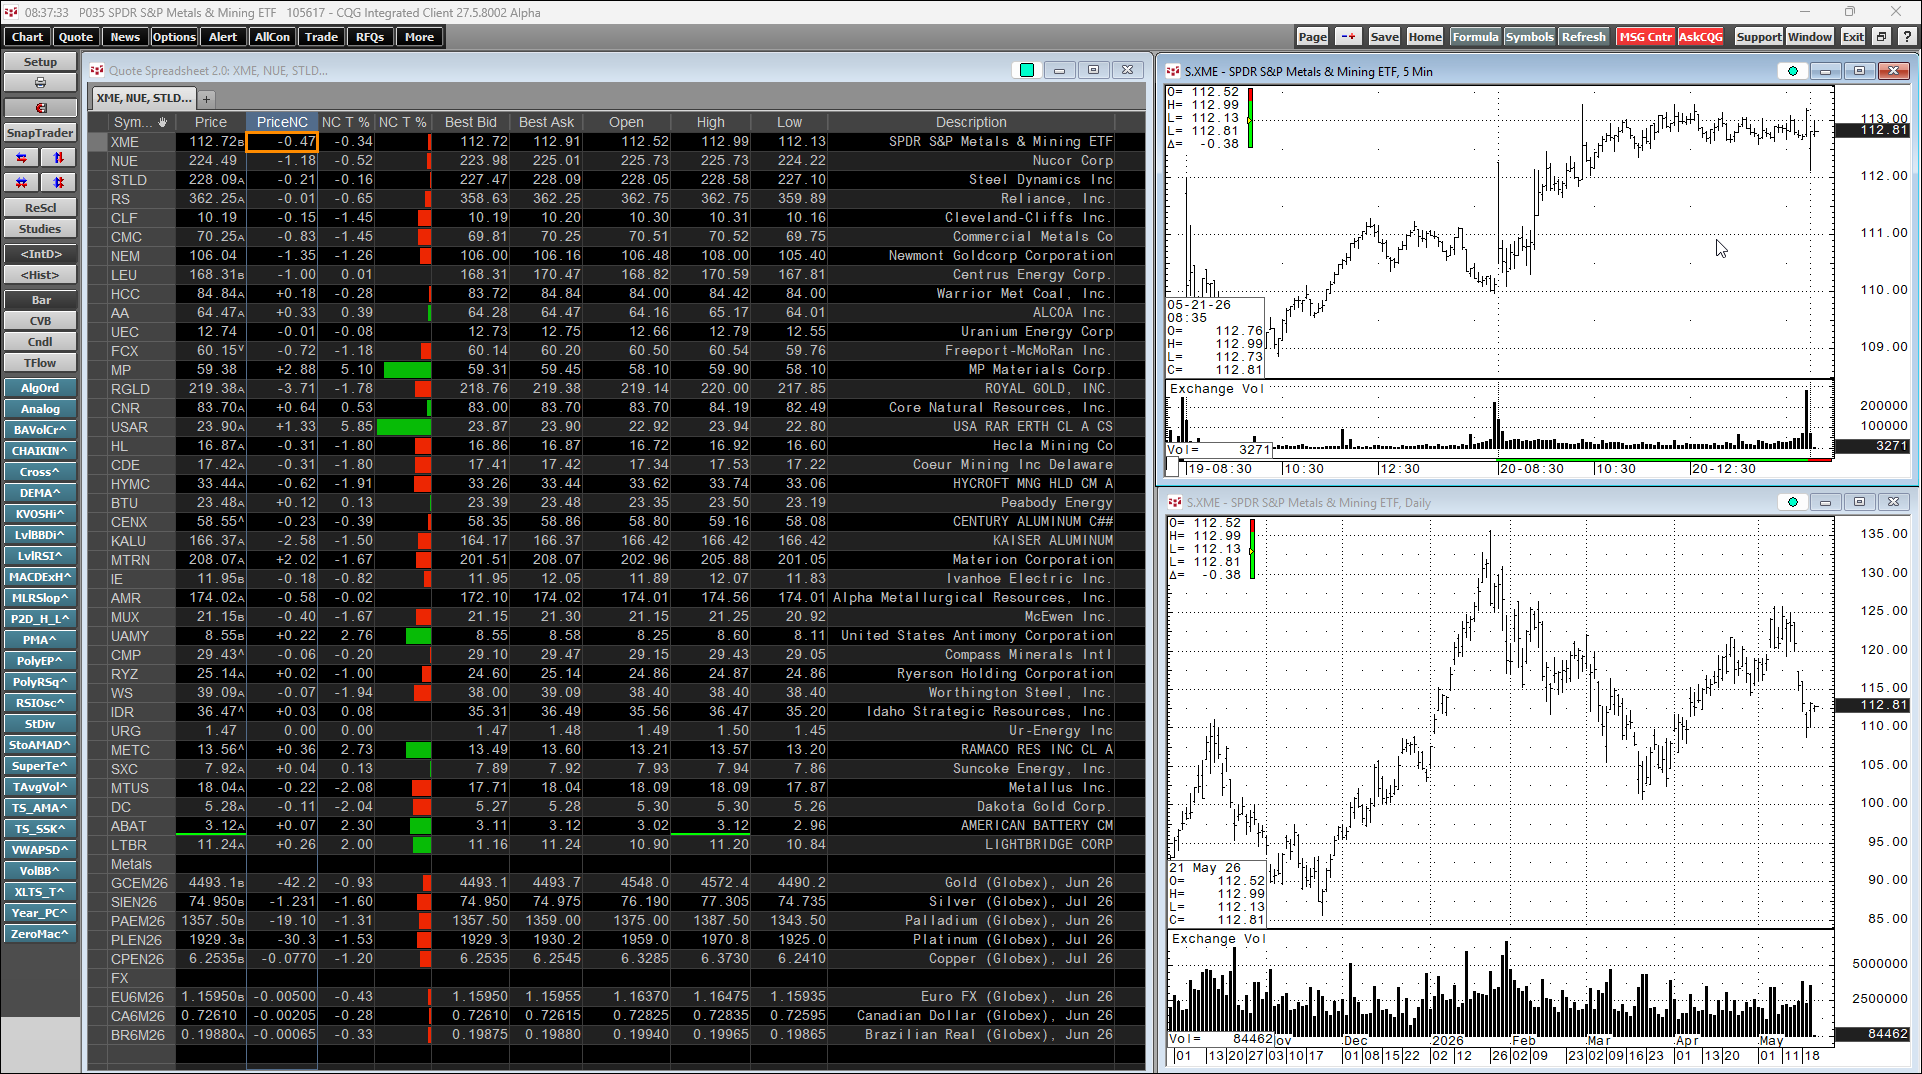
The current holdings are as of 5/20/2026. The QuoteSpreadsheet V2 is linked to the two charts. Clicking on any symbol will change the symbols in the charts.
Requires CQG Integrated Client or CQG QTrader, data enablements for the NYSE and Nasdaq exchanges.