This Excel Dashboard tracks the holdings of the Defiance Drone & Modern Warfare ETF.
From their Web Site:
Modern defense is being reshaped by drones, autonomous systems, and AI-driven capabilities operating across land, sea, air, and space. From military and commercial drones to eVTOL aircraft, space and defense infrastructure, and military cybersecurity, a new generation of technology is transforming how nations defend, secure, and operate. This fund targets the companies building that future across drones, unmanned systems, AI-driven warfare technology, and advanced air mobility.
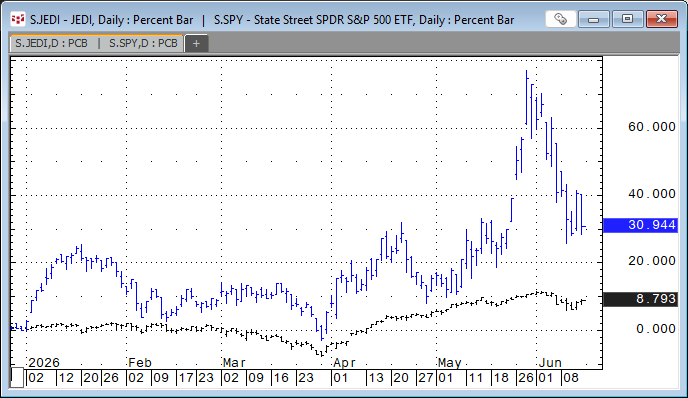
The image below compares percentage change from the end of last year for the JEDI ETF (blue) and the S&P 500 ETF (black).
There are 42 companies.
Top Ten Holdings (As of 6/12/2026)
| Symbol | Name | % |
|---|---|---|
| S.US.RDW | Redwire Corp | 14.08% |
| S.US.UMAC | Unusual Machines Inc | 10.92% |
| S.US.LUNR | Intuitive Mchns Cm | 7.27% |
| S.US.ONDS | Ondas Holdings Cm | 6.91% |
| S.US.AI | C3.Ai, Inc. | 5.19% |
| S.US.RKLB | Rocket Lab Corp Cmn | 5.16% |
| S.US.RCAT | Red Cat Holdings Cmn | 4.77% |
| S.US.ASTS | Ast Spacemobile Cm A | 4.06% |
| S.US.ACHR | Archer Aviation Inc | 3.93% |
| S.US.BKSY | Blacksky Technology Inc. | 3.36% |
Top Five performers for the year (As of 6/12/2026)
| # | Symbol | Name | Gain |
|---|---|---|---|
| 1 | S.US.IRDM | Iridium Comm Inc | 172.27% |
| 2 | S.AU.ELS | Elsight Limited | 172.08% |
| 3 | S.US.SPIR | Spire Global, Inc. | 143.07% |
| 4 | S.US.RDW | Redwire Corp | 98.95% |
| 5 | S.US.UMAC | Unusual Machines Inc | 91.76% |
Bottom Five performers for the year (As of 6/12/2026)
| # | Symbol | Name | Gain |
|---|---|---|---|
| 38 | S.US.AVAV | Aerovironment, Inc. | -29.48% |
| 39 | S.US.JOBY | Joby Aviation, Inc. | -30.68% |
| 40 | S.US.LDOS | Leidos Holdings, Inc. | -32.28% |
| 41 | S.US.ACHR | Archer Aviation Inc | -32.45% |
| 42 | S.US.EVTL | Vertical Aerospace Ltd. | -59.85% |
Below is an image of the downloadable Excel Dashboard. During the trading session, the Excel dashboard dynamically ranks the individual stocks held by JEDI.
The Excel dashboard displays the top fifteen positive and bottom fifteen negative performers as histogram bar charts, along with their respective net percent change for today's trading session.
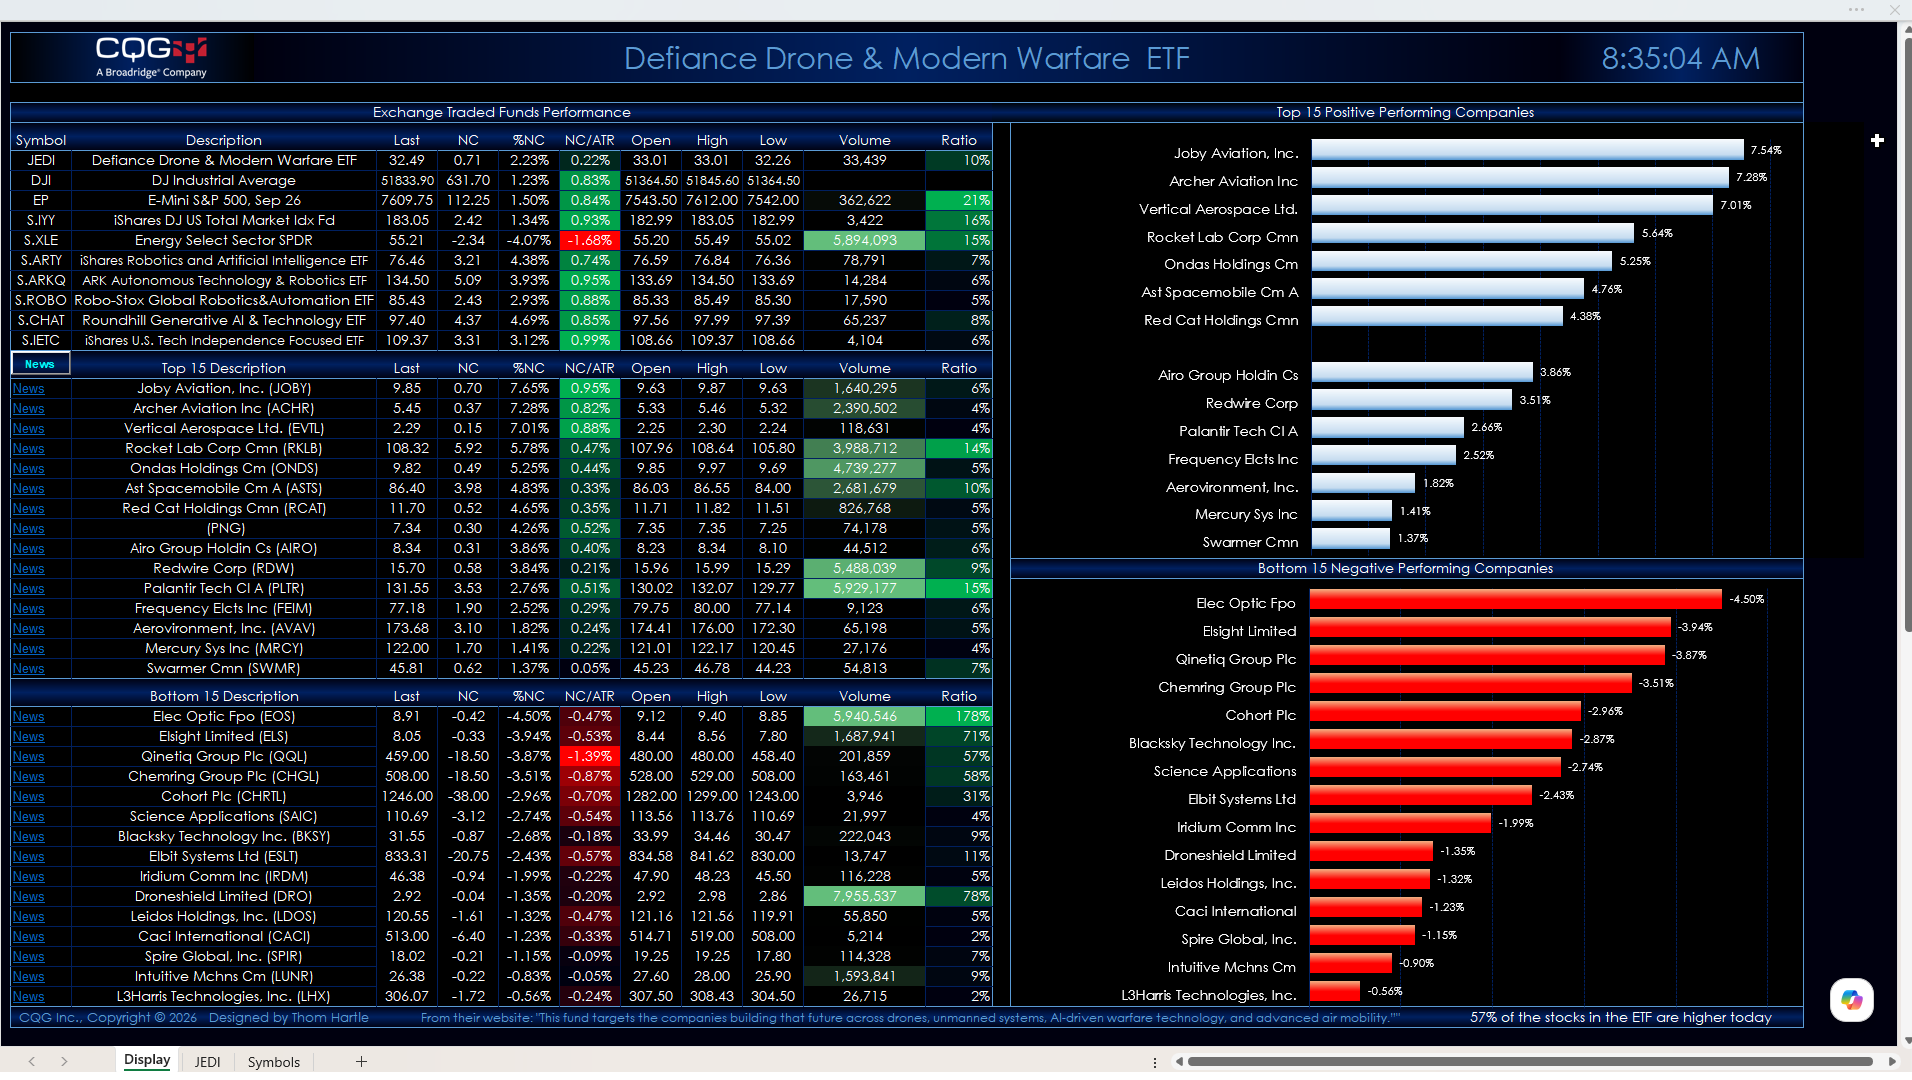
To the left, the top section of the quote display allows you to enter your own symbols.
The second section displays the ranked top fifteen performers. The third section displays the ranked bottom fifteen performers.
Quote data includes today's net change as a ratio to the 21-day Average True Range study. Next to today's traded volume is a column that calculates the ratio of today's volume versus the 21-day average of the volume. This ratio column gives you a sense of how active today's trading is. Readings of 100% and higher indicate active trading.
A key feature next to each company name is a link to Yahoo Finance. Clicking the News link will take you to the Yahoo page for that symbol. Note that this could take approximately 30 seconds to open in a browser.
If you open another Excel spreadsheet, then this dashboard will no longer be the active spreadsheet. The macro that updates the links and ranks the stocks by performance will stop. To start the macro, simply click the News toolbar button in the first column.
The current holdings are as of 6/12/2026. There is a Symbols tab with instructions detailing where to download the latest posted spreadsheet with the current holdings and steps to update the dashboard.
Eleven companies trade on Exchanges outside of the US.
| Symbol | Name | Exchange |
|---|---|---|
| S.AU.DRO | Droneshield Limited | Australian Stock Exchange |
| S.AU.ELS | Elsight Limited | Australian Stock Exchange |
| S.AU.EOS | Elec Optic FPO | Australian Stock Exchange |
| S.CA.PNG | Kraken Robotics Inc. | Toronto Venture Exchange |
| S.CX.CHGL | Chemring Group Plc | Cboe Europe - Chi-X |
| S.CX.CHRTL | Cohort Plc | Cboe Europe - Chi-X |
| S.CX.QQL | Qinetiq Group Plc | Cboe Europe - Chi-X |
| S.DX.EXAP | Exail Technologies SA | Cboe Europe - DXE |
| S.DX.HAGD | Hensoldt AG | Cboe Europe - DXE |
| S.DX.HOP | Thales SA | Cboe Europe - DXE |
| S.DX.SAABBS | Saab AB | Cboe Europe - DXE |
Requires CQG Integrated Client or CQG QTrader, data enablements for the NYSE, NASDAQ, Australian Stock Exchange, Toronto Venture Exchange, Cboe Europe - Chi-X, Cboe Europe – DXE, and Excel 2016 or more recent locally installed.