
This post details using Excel's MAP function to rank the companies in the S&P 500 index performance relative to the S&P 500 index's performance. This is defined by today's percentage net change of each company as a ratio to the S&P 500 percentage net change.
To calculate the ratio of the stock's percent net change relative to the S&P 500 percentage net change the Excel MAP function is used.
The MAP Function requires an array declaration and the LAMBDA function to be applied using the array. Use a LAMBDA function to create custom, reusable functions.
=MAP (array1, lambda_or_array<#>)
In cell F1 is the S&P 500 net percentage change RTD formula:
=IFERROR(RTD("cqg.rtd", ,"ContractData","X.SPC", "PerCentNetLastTrade",, "T")/100,"")In cell F2:
=MAP(E2:E504,LAMBDA(x,x-$F$1))
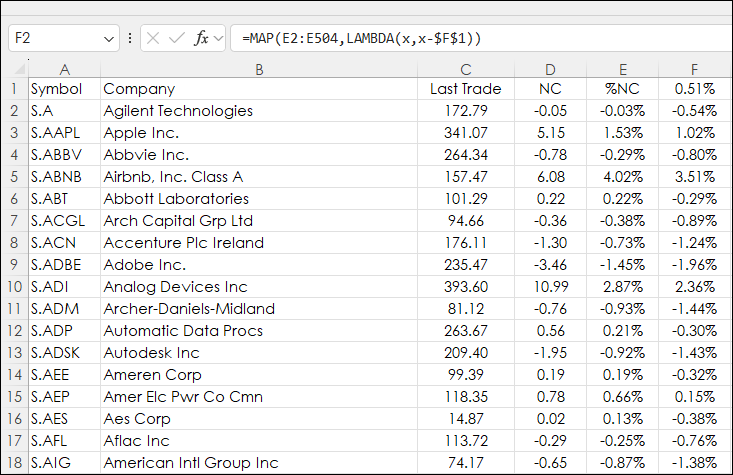
Column F2 populates with the result, the difference in performance by the stock minus the S&P 500:
Three other study values are displayed on the Display tab and are pulled from the Data tab:
Volume Ratio, Column O (Today's Volume/Yesterday's 21-day Volume Average):
= IFERROR(N2/RTD("cqg.rtd",,"StudyData", $A2, "MA", "InputChoice=Vol,MAType=Sim,Period=21", "MA","D","-1","all",,,,"T"),"")NC Ratio Column P (Net Change/21-Day Average True Range):
=IFERROR(D2/RTD("cqg.rtd",,"StudyData","ATR("&A2&",MAType:=Sim,Period:=21)","Bar",, "Close", "D",,,,,,"T"),"")Z_Score Column S (Current Price- 21 day Moving average)/21-day Standard Deviation:
=IFERROR(STANDARDIZE(C2,Q2,R2),"")
There are other RTD formulas on the Data tab that are not used on the Display tab.
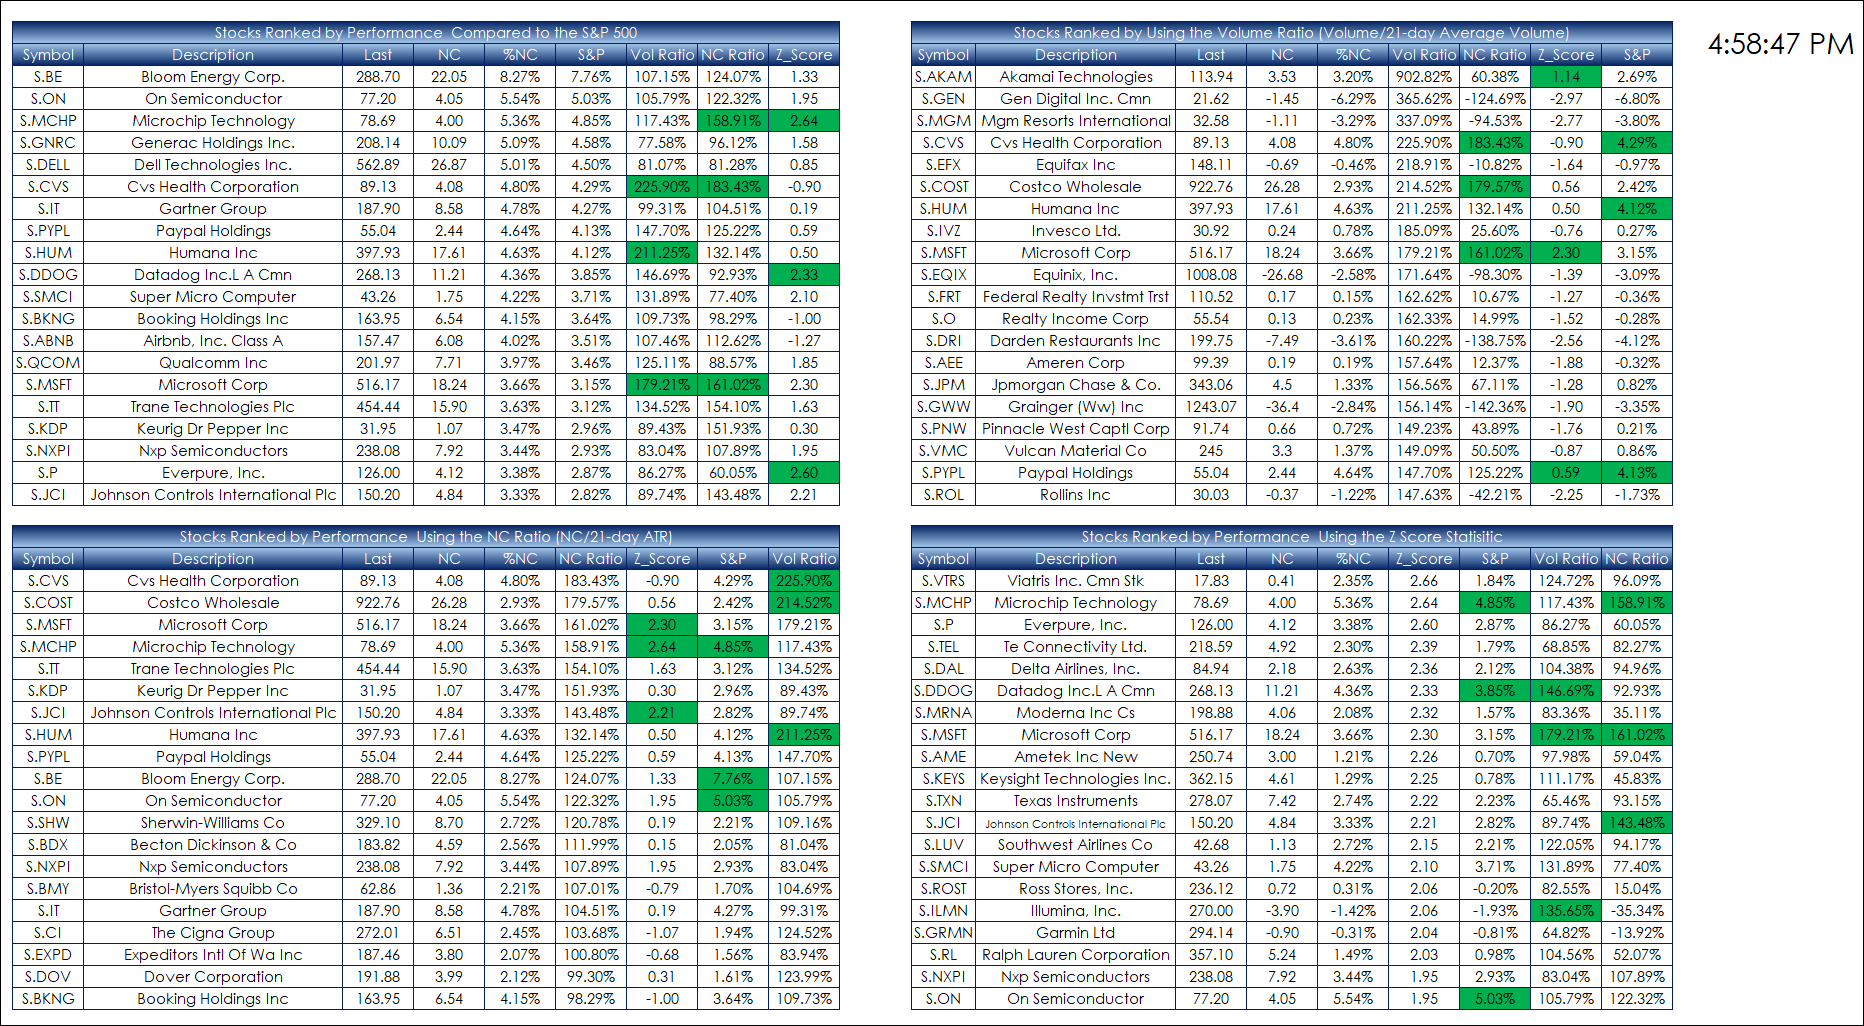
There are four display blocks. The first one displays the top 20 symbols ranked and sorted based on column F from the Data tab. The Column title is "S&P".
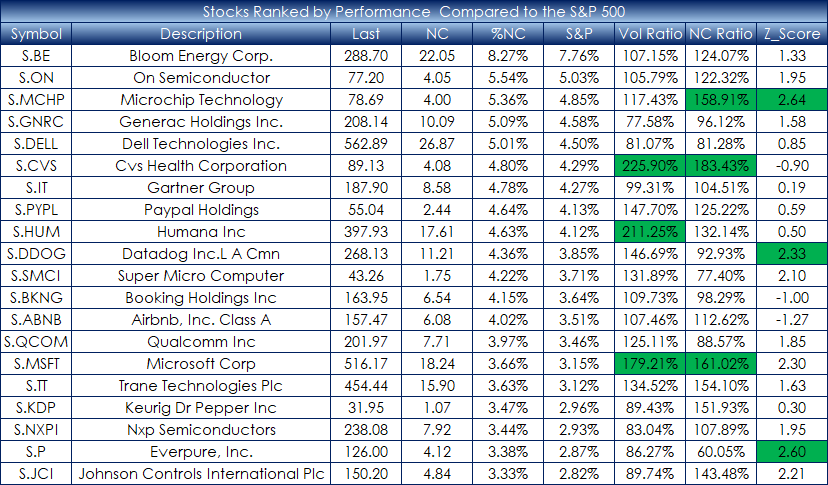
Above the Vol Ratio, the NC Ratio, and the Z_Score columns are using the symbols from the first column. Each column has color conditioning highlighting the top three stocks.
Notice that symbol S.MCHP has two green cells indicating strong session performance. Symbol S.CVS has two green cells except the Z_Score is negative indicating the stock is below the 21-day moving average.
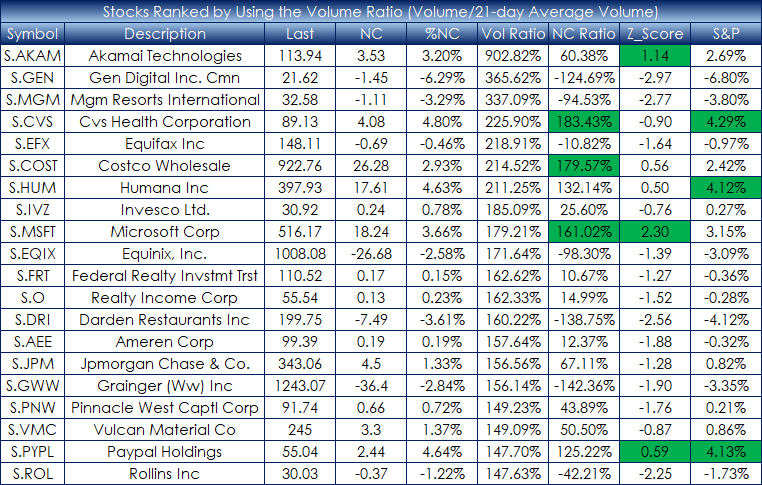
There are four display blocks. The top right block is the same as the top left block except the S&P column has moved to the end and the display block is based on the ranks and sorted symbols from the Data tab using the Vol Ratio (Column O).
The bottom left display block uses symbols sorted and ranked based on the NC Ratio (Column P on the Data tab).
The bottom right display block uses symbols sorted and ranked based on the Z_Score (Column S on the Data Tab). The next image is the full Display tab.
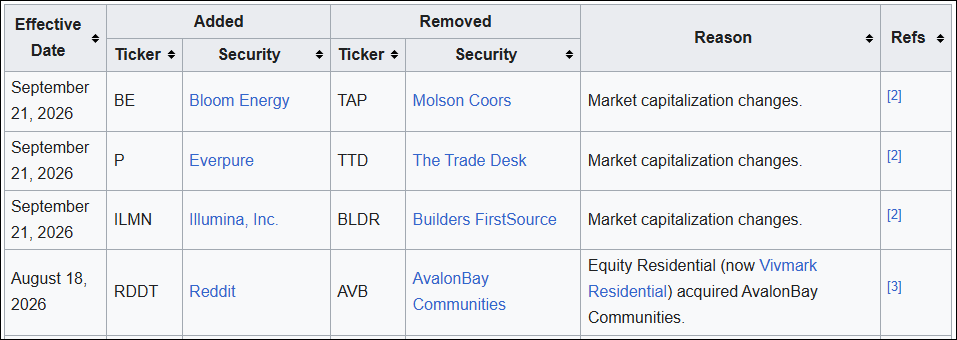
To keep your symbols list for the S&P 500 up to date Wikipedia offers a table: https://en.wikipedia.org/wiki/Historical_components_of_the_S%26P_500
This Excel dashboard utilized the Excel MAP function to calculate the performance ratio between each stock and the S&P 500 using a single formula.
Requires CQG Integrated Client or CQG QTrader, data enablements for the exchanges, and Excel 365 or more recent locally installed, not in the Cloud.