This midweek look shows the Nikkei 225 (Osaka), Sep 26 contract, with a gain of +3.97%. The best performer in the US market is the E-mini NASDAQ 100, Sep 26 contract showing a gain of +1.67… more
Equities

This midweek look shows the Nikkei 225 (Osaka), Sep 26 contract, with a loss of -1.48%. The best performer in the US market is the E-mini Dow, Sep 26 contract showing a gain of +0.02%. The… more
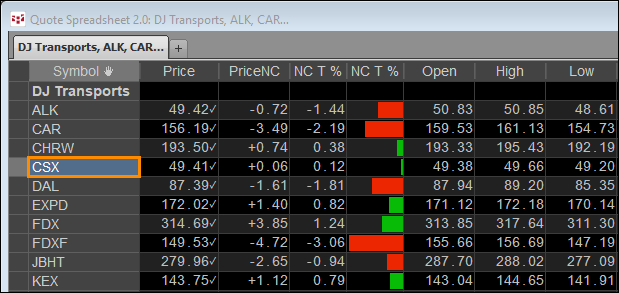
This post offers a downloadable CQG PAC for installing the DJT and DJU Page in CQG IC or QTrader. The page details the current session's market performance of the constituents of the two averages… more
This midweek look shows the Nikkei 225 (Osaka), Sep 26 contract, with a loss of -3.48%. The best performer in the US market is the E-mini S&P 500, Sep 26 contract showing a loss of -0.… more
This midweek look shows the Nikkei 225 (Osaka), Sep 26 contract, with a gain of +0.14%. The best performer in the US market is the NASDAQ 100, Sep 26 contract showing a gain of +2.62%. The… more
This midweek look shows the Nikkei 225 (Osaka), Sep 26 contract, with a loss of -3.55%. The best performer in the US market is the E-mini Dow, Sep 26 contract showing a gain of +0.38%. The… more
This midweek look shows the Nikkei 225 (Osaka), Sep 26 contract, with a gain of +6.90%. The best performer in the US market is the E-mini Dow, Sep 26 contract showing a gain of +1.78%. The… more
This midweek look shows the Nikkei 225 (Osaka), Jun 26 contract, with a loss of -4.72%. The best performer in the US market is the E-mini Midcap, Jun 26 contract showing a gain of -0.23%.… more
This midweek look shows the Nikkei 225 (Osaka), Jun 26 contract, with a gain of +2.89%. The best performer in the US market is the E-mini NASDAQ 100, Jun 26 contract showing a gain of +0.80… more
This midweek look shows the Nikkei 225 (Osaka), Jun 26 contract, with a gain of +2.68%. The best performer in the US market is the E-mini NASDAQ 100, Jun 26 contract showing a gain of +1.40… more