
This post details a downloadable Microsoft Excel dashboard that tracks the current sessions performance of the holdings of the iShares S&P 100 ETF (Symbol: OEF).
The iShares S&P 100 ETF seeks to track an index composed of 100 U.S. mega-cap stocks. The fund offers access to blue-chip stocks. The index is the S&P 100.
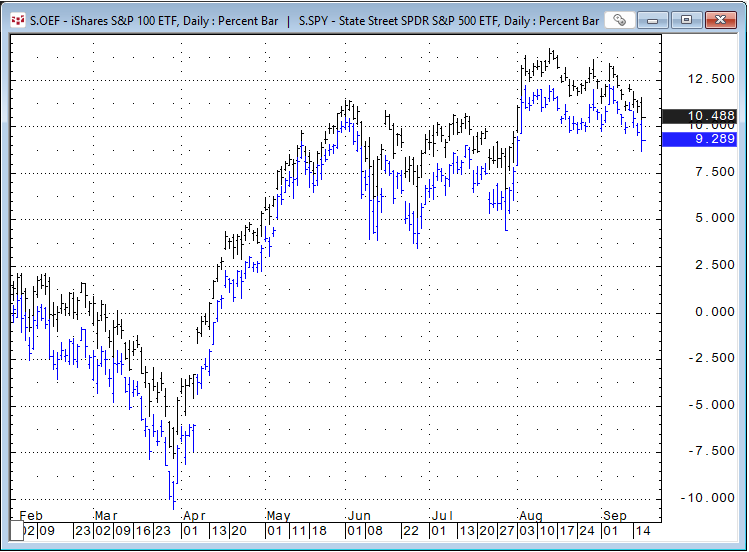
The image below shows the current year performance of OEF ETF (blue) versus the SPY ETF (black).
Top Ten Holdings (as of 9/15/2026)
| Symbol | Name | Sector | % |
|---|---|---|---|
| S.NVDA | Nvidia Corporation | Information Technology | 10.92% |
| S.AAPL | Apple Inc. | Information Technology | 10.29% |
| S.MSFT | Microsoft Corp | Information Technology | 7.68% |
| S.AMZN | Amazon.Com Inc | Consumer Discretionary | 5.08% |
| S.GOOGL | Alphabet Cl A Cmn | Communication | 4.24% |
| S.AVGO | Broadcom Inc. | Information Technology | 3.39% |
| S.GOOG | Alphabet Cl C Cap | Communication | 3.38% |
| S.META | Meta Platforms, Inc. | Communication | 3.12% |
| S.MU | Micron Technology | Information Technology | 2.20% |
| S.TSLA | Tesla, Inc. | Consumer Discretionary | 2.13% |
Top Ten Percentage Gains (as of 9/15/2026)
| Symbol | Name | % Annual NC |
|---|---|---|
| S.MU | Micron Technology | 224.64% |
| S.INTC | Intel Corp | 173.85% |
| S.HONA | Honeywell Aerospace Inc | 164.18% |
| S.AMD | Adv Micro Devices | 139.31% |
| S.PANW | Palo Alto Ntwks Cm | 103.94% |
| S.AMAT | Applied Materials | 61.63% |
| S.LRCX | Lam Research Corp | 57.28% |
| S.TXN | Texas Instruments | 50.25% |
| S.DE | Deere & Company | 43.80% |
| S.COP | Conocophillips | 41.59% |
Bottom Ten Percentage Gains (as of 9/15/2026)
| Symbol | Name | % Annual NC |
|---|---|---|
| S.LOW | Lowes Companies Inc | -19.51% |
| S.IBM | International Business Machines | -19.82% |
| S.BKNG | Booking Holdings Inc | -19.99% |
| S.TSLA | Tesla, Inc. | -20.38% |
| S.CMCSA | Comcast Corp A | -20.61% |
| S.ORCL | Oracle Corporation | -26.55% |
| S.ADBE | Adobe Inc. | -28.43% |
| S.ACN | Accenture Plc Ireland | -29.32% |
| S.ISRG | Intuitive Surg, Inc. | -32.50% |
| S.INTU | Intuit Inc | -51.97% |
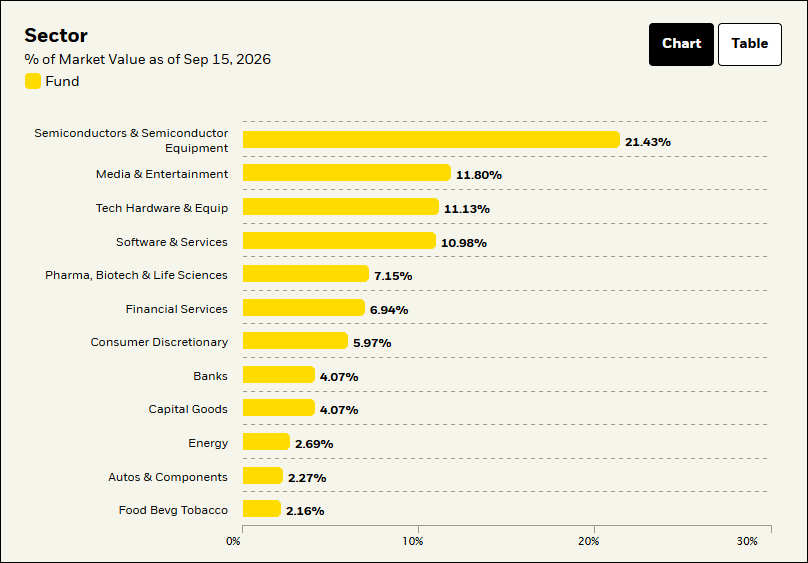
Below is a chart of the holdings by sector.
Below is an image of the downloadable Excel Dashboard. During the trading session, the Excel dashboard dynamically ranks the individual stocks held by IGE.
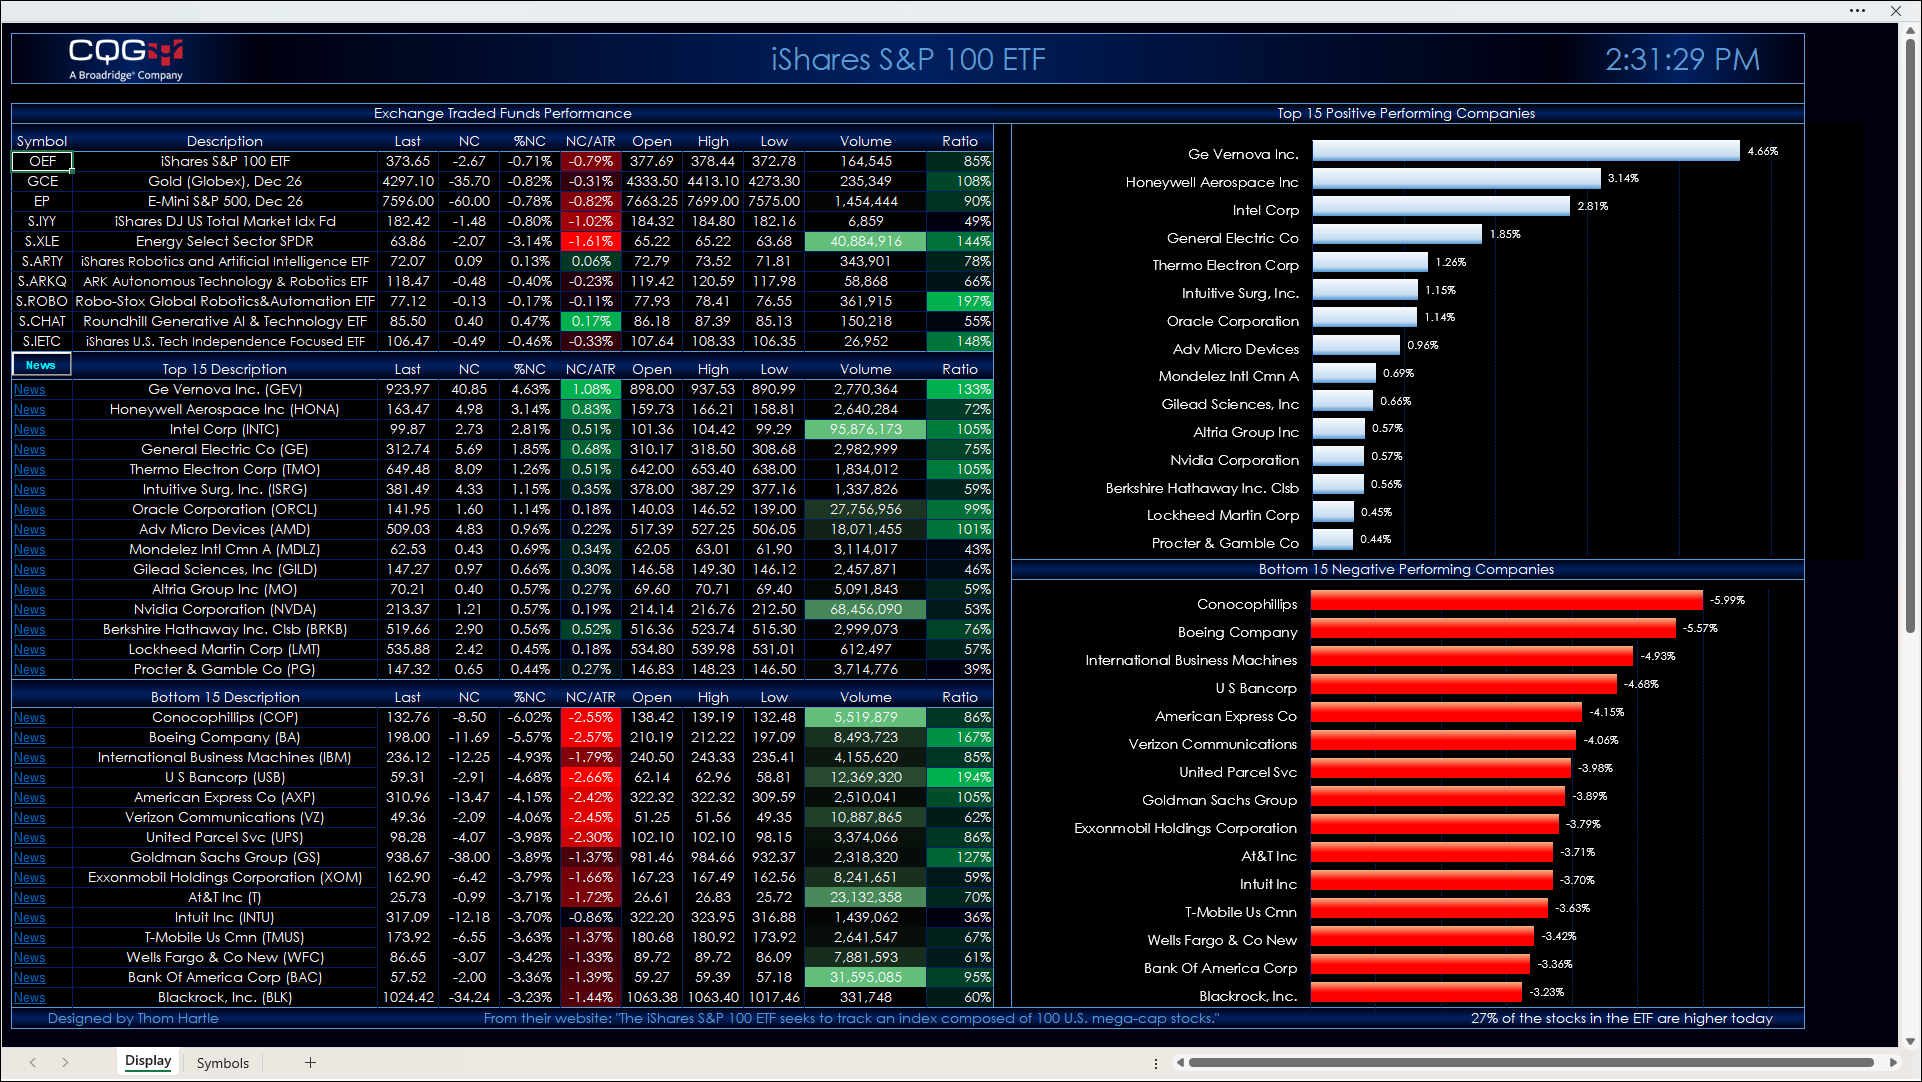
The Excel dashboard shows the top fifteen positive and bottom fifteen negative performers as histogram bar charts, along with their respective net percent change for today's trading session.
The top section of the quote display allows you to enter your own symbols.
The second section displays the top fifteen performers. The third section displays the bottom fifteen performers.
Quote data includes today's net change as a ratio to the 21-day Average True Range study. Next to today's traded volume is a column that calculates the ratio of today's volume versus the 21-day average of the volume. This ratio column gives you a sense of how active today's trading is relative to recent history. Readings of 100% and higher indicate active trading.
A key feature next to each company name is a link to Yahoo Finance. Clicking the News link will take you to the Yahoo page for that symbol. Note that this could take approximately 30 seconds to open in a browser.
If you open another Excel spreadsheet, then this dashboard will no longer be the active spreadsheet. The macro that updates the links and ranks the stocks by performance will stop. To start the macro, simply click the News toolbar button in the first column.
The current holdings are as of 9/15/2026. There is a Symbols tab with instructions detailing steps to update the dashboard.
Make sure to lower your Excel Realtime Data (RTD) throttle to 100 milliseconds. Learn how to do that here.
Requires CQG Integrated Client or CQG QTrader, data enablements for the NYSE and Nasdaq.