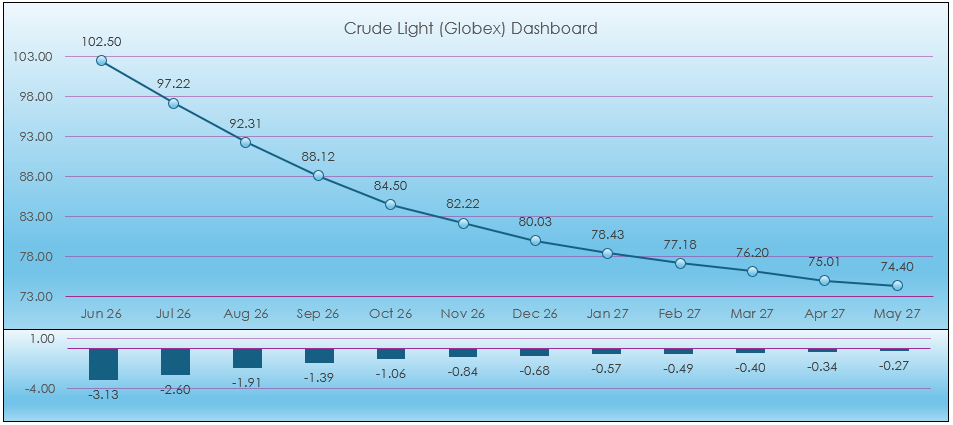
This post presents a macro enabled Excel Light Crude Oil dashboard using combined functionality detailed in previous Workspace posts. The dashboard uses numerous RTD calls for today's market… more
Energy
This post is similar to the recent post "Excel 365 GROUPBY and XLOOKUP".
That post introduced using the Excel function GROUPBY to arrange by sectors the stocks in the NASDAQ 100 and identify… more
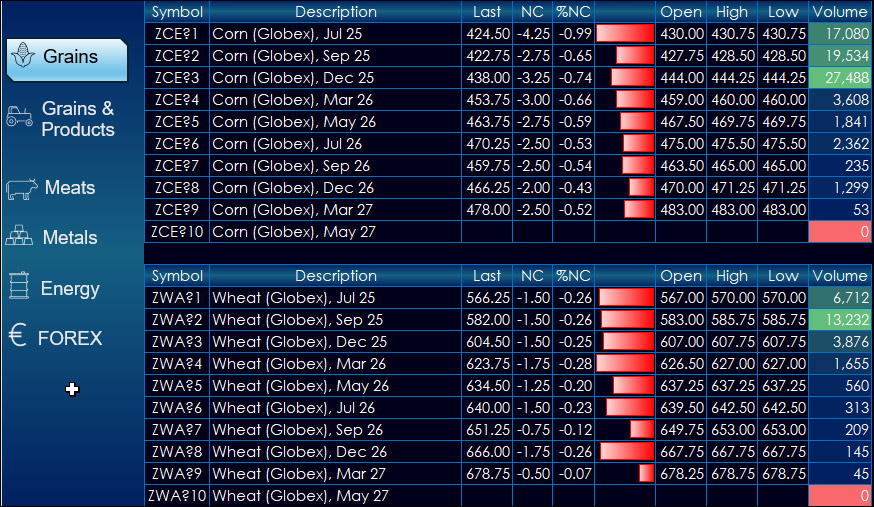
This dashboard provides market data for CME products. The dashboard uses a navigation bar instead of tabs.
The left-hand side provides market data for products. The right-hand side… more
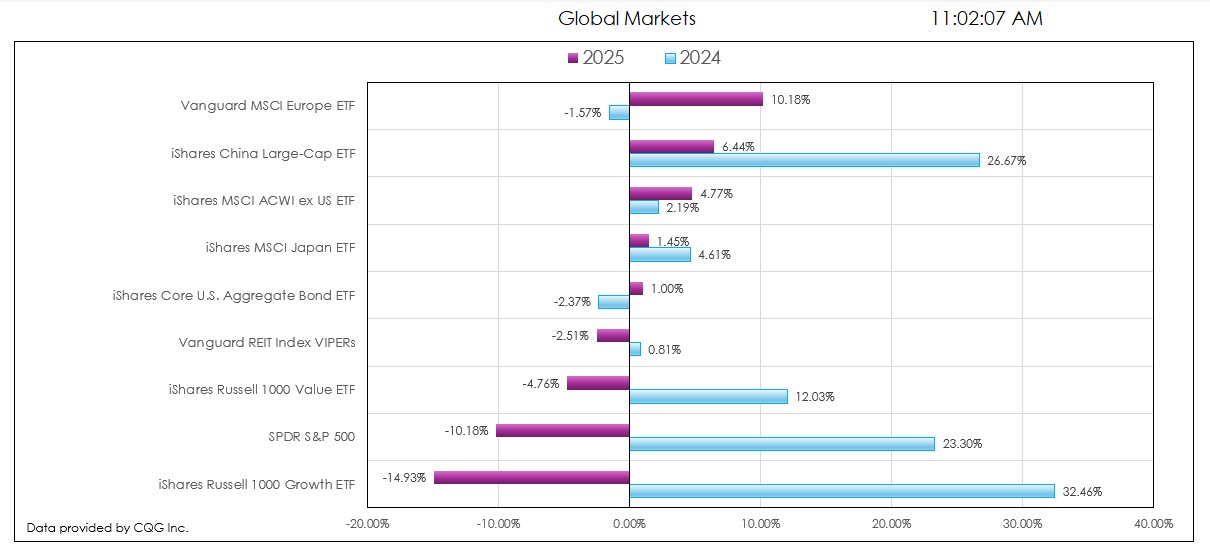
This post details the downloadable Excel Market Performance Dashboard's features and functions. The dashboard has seven tabs (the first is data and the other tabs display a chart and a table of… more
Introduction
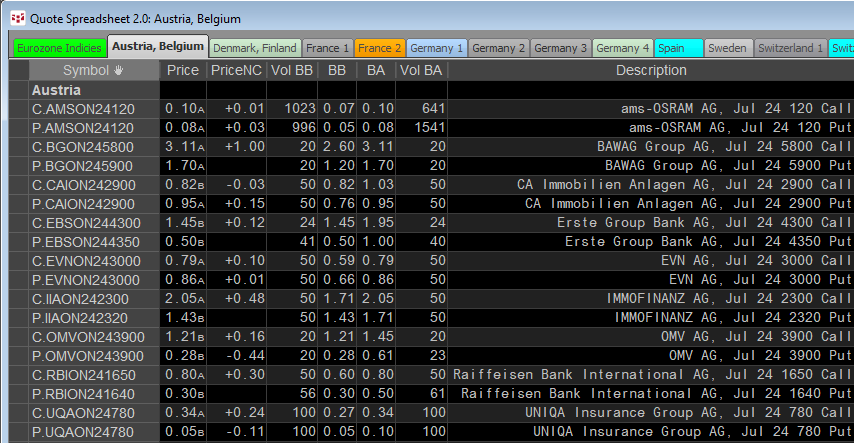
Cboe Europe Derivatives (CEDX) is a European derivatives marketplace which enables participants to access equity derivatives markets for quotes and trade execution.
CEDX offers a… more
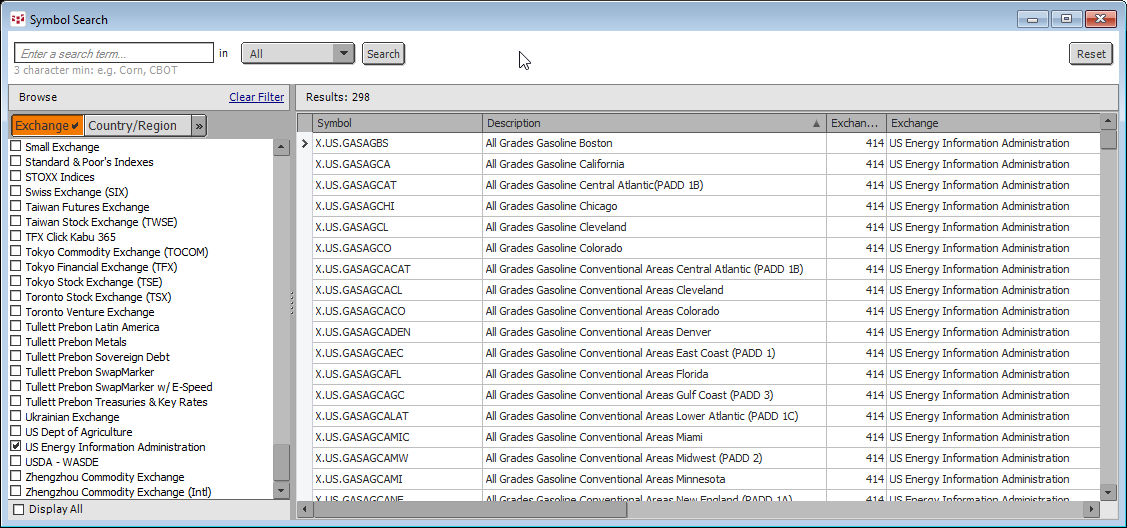
The CQG Data Quality team has added the US Weekly Retail Gasoline and Diesel Prices including the PADD1 to PADD 5 numbers published by the US Energy Information Administration (EIA). There are a… more
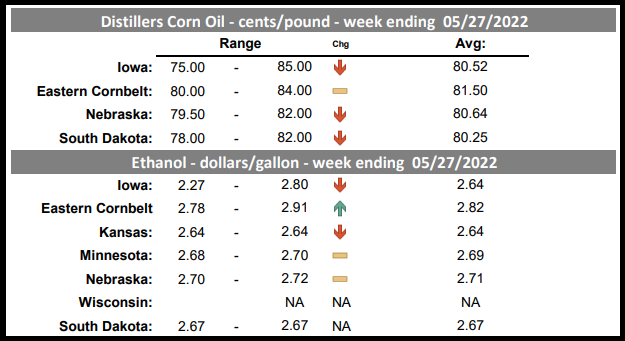
The CQG Data Quality Team has added the USDA Daily Ethanol Report found under USDA in the CQG Symbol Finder. Thirty-four new symbols are available. At the bottom of the post is a CQG PAC that… more
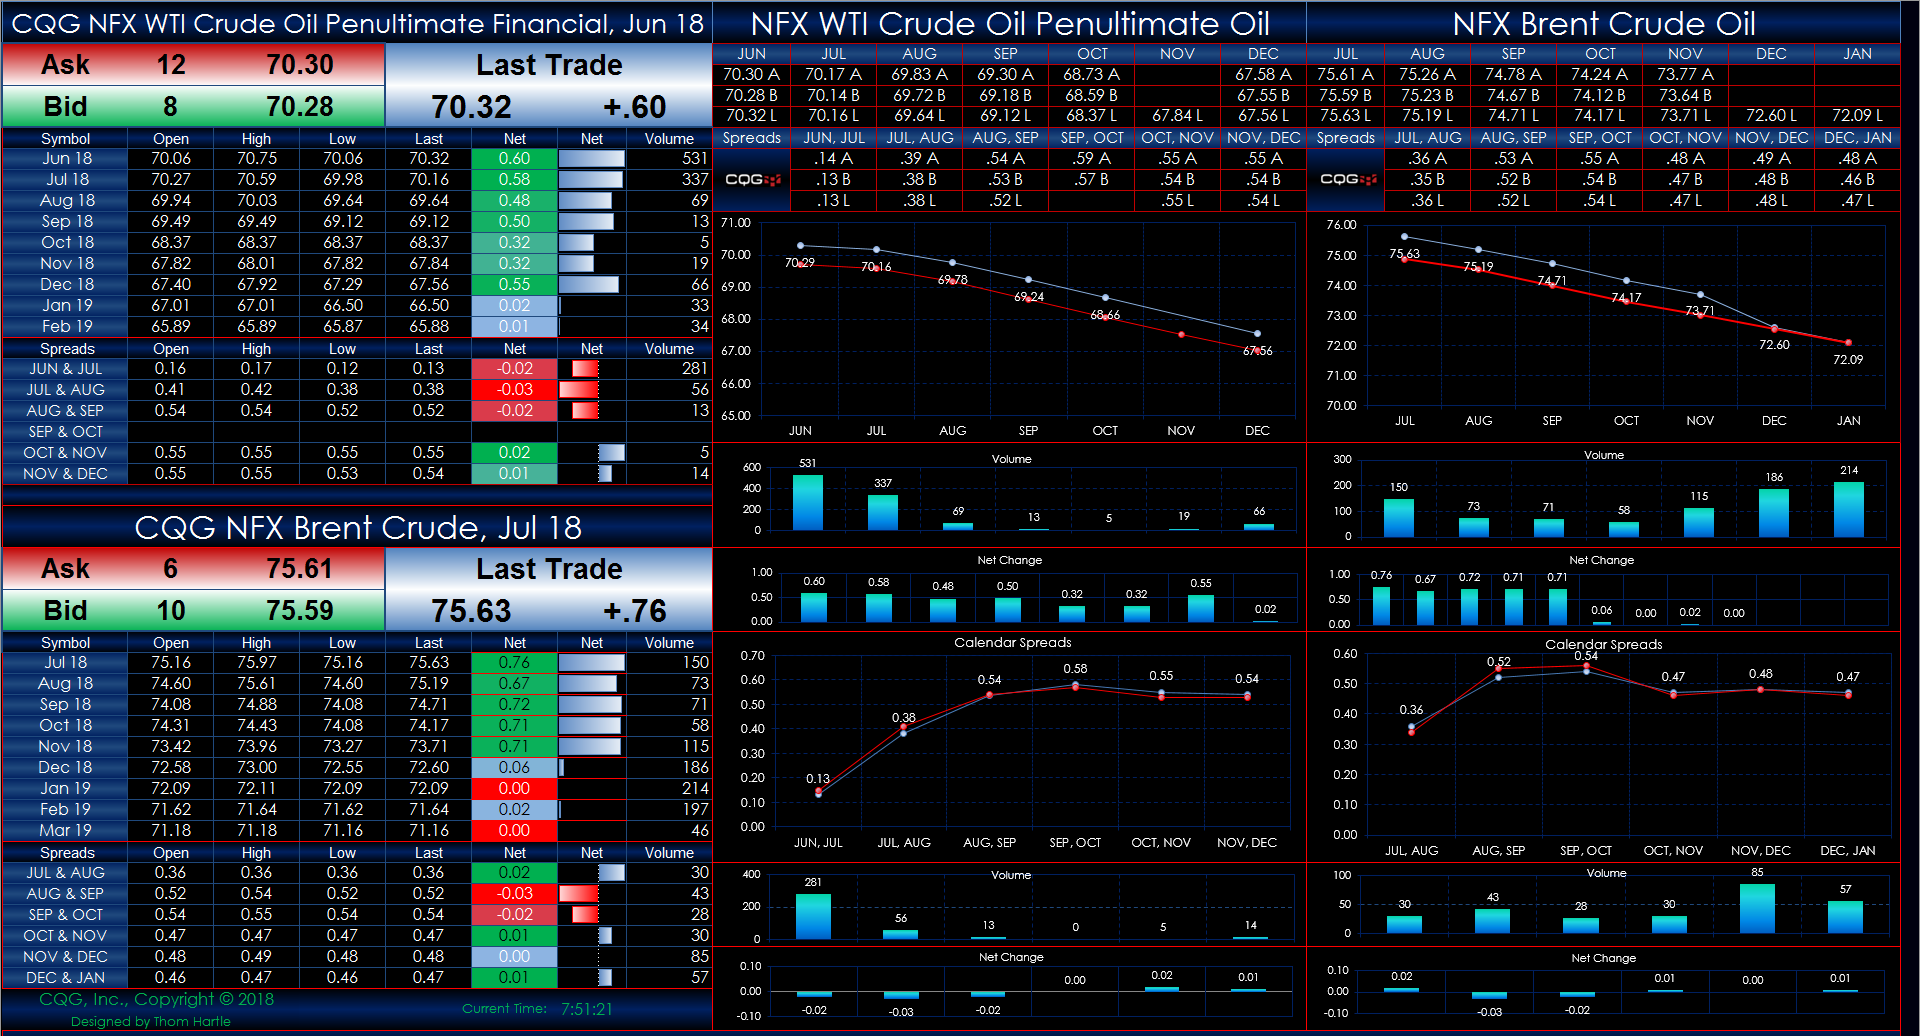
This Microsoft Excel® spreadsheet pulls in market data for NFX WTI Crude Oil Penultimate Financial (symbol: NTQ) and NFX Brent Crude (symbol: BFQ), both traded on the NASDAQ OMX Futures Exchange (… more
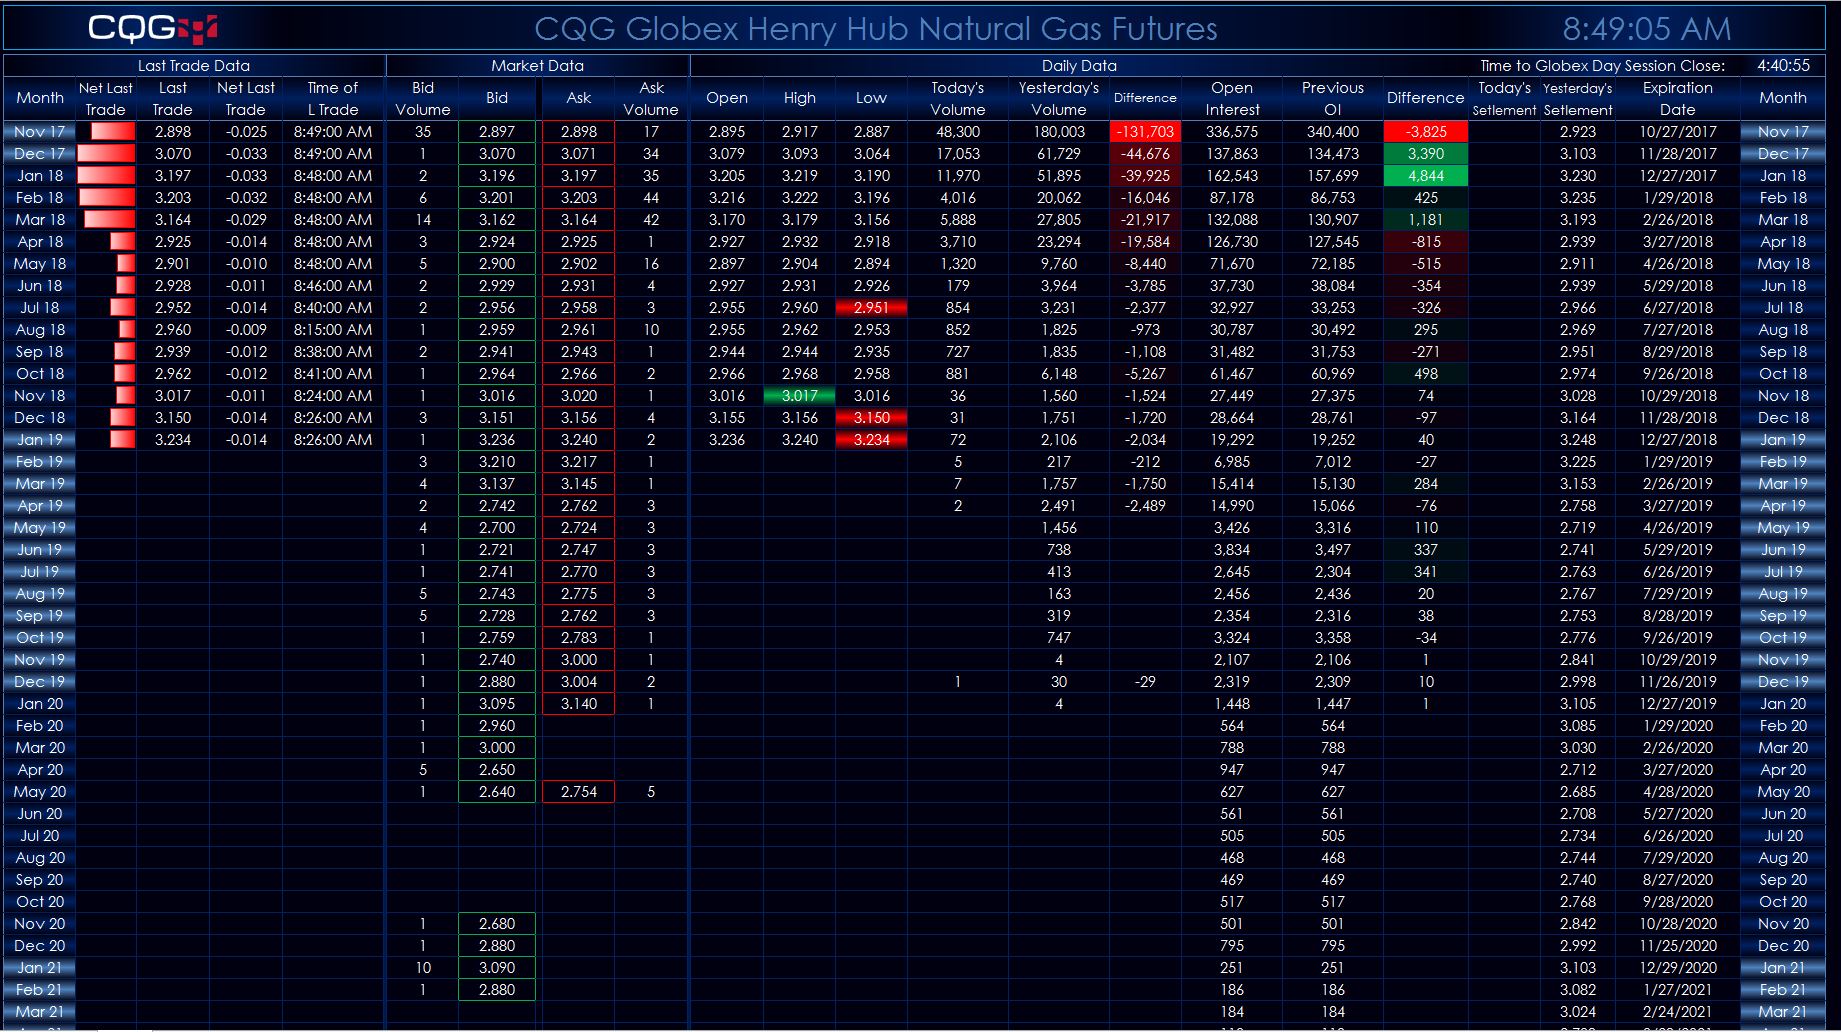
This Microsoft Excel® dashboard has three tabs. The first tab displays today’s market quotes, volume, and open interest data. If the last price is matching the open price, then the open price… more
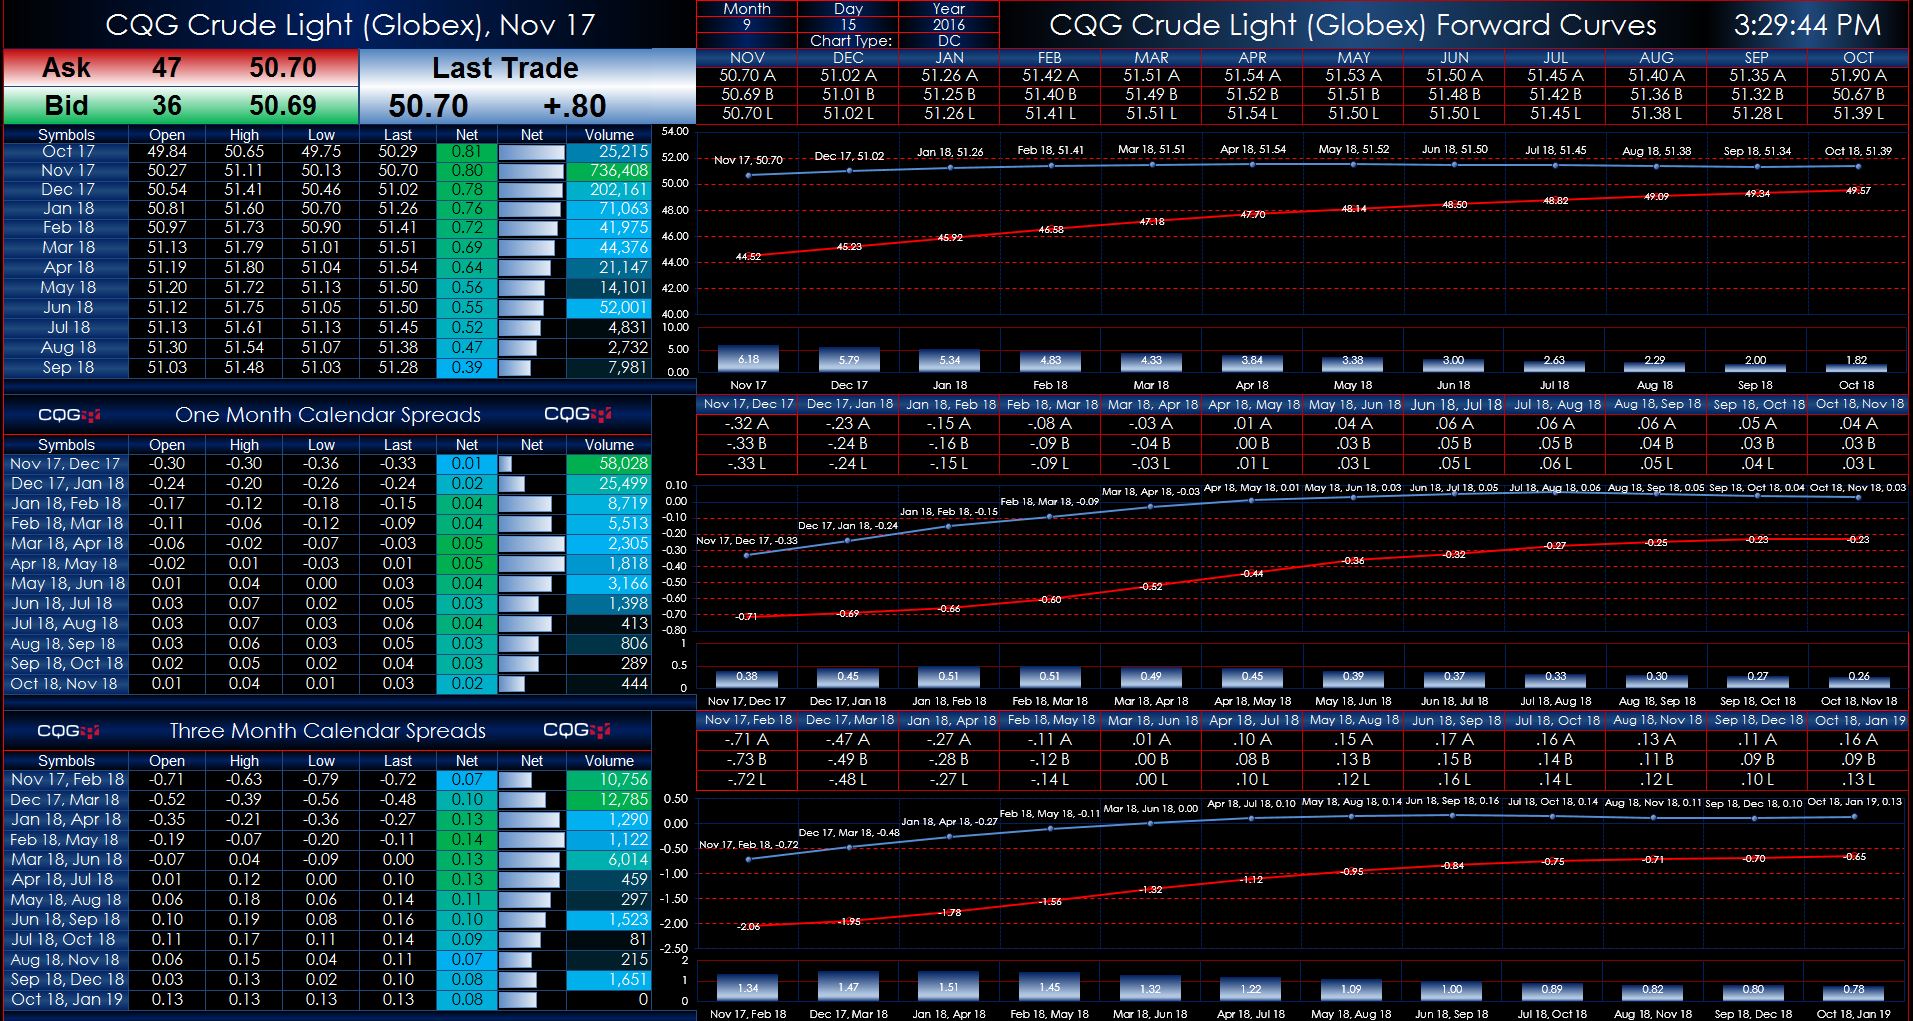
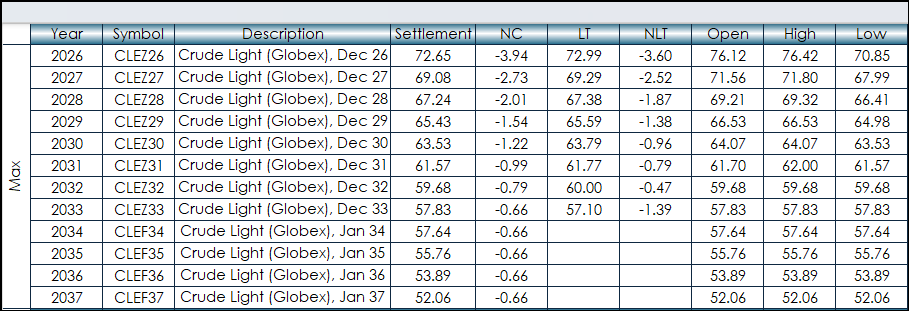
These two Microsoft Excel® spreadsheets present Globex crude oil market data and forward curves, both current and historical. Two dashboards are available: The first the data includes outrights… more