NFX Crude Oil Forward Curves Dashboard

This Microsoft Excel® spreadsheet pulls in market data for NFX WTI Crude Oil Penultimate Financial (symbol: NTQ) and NFX Brent Crude (symbol: BFQ), both traded on the NASDAQ OMX Futures Exchange (NFX).

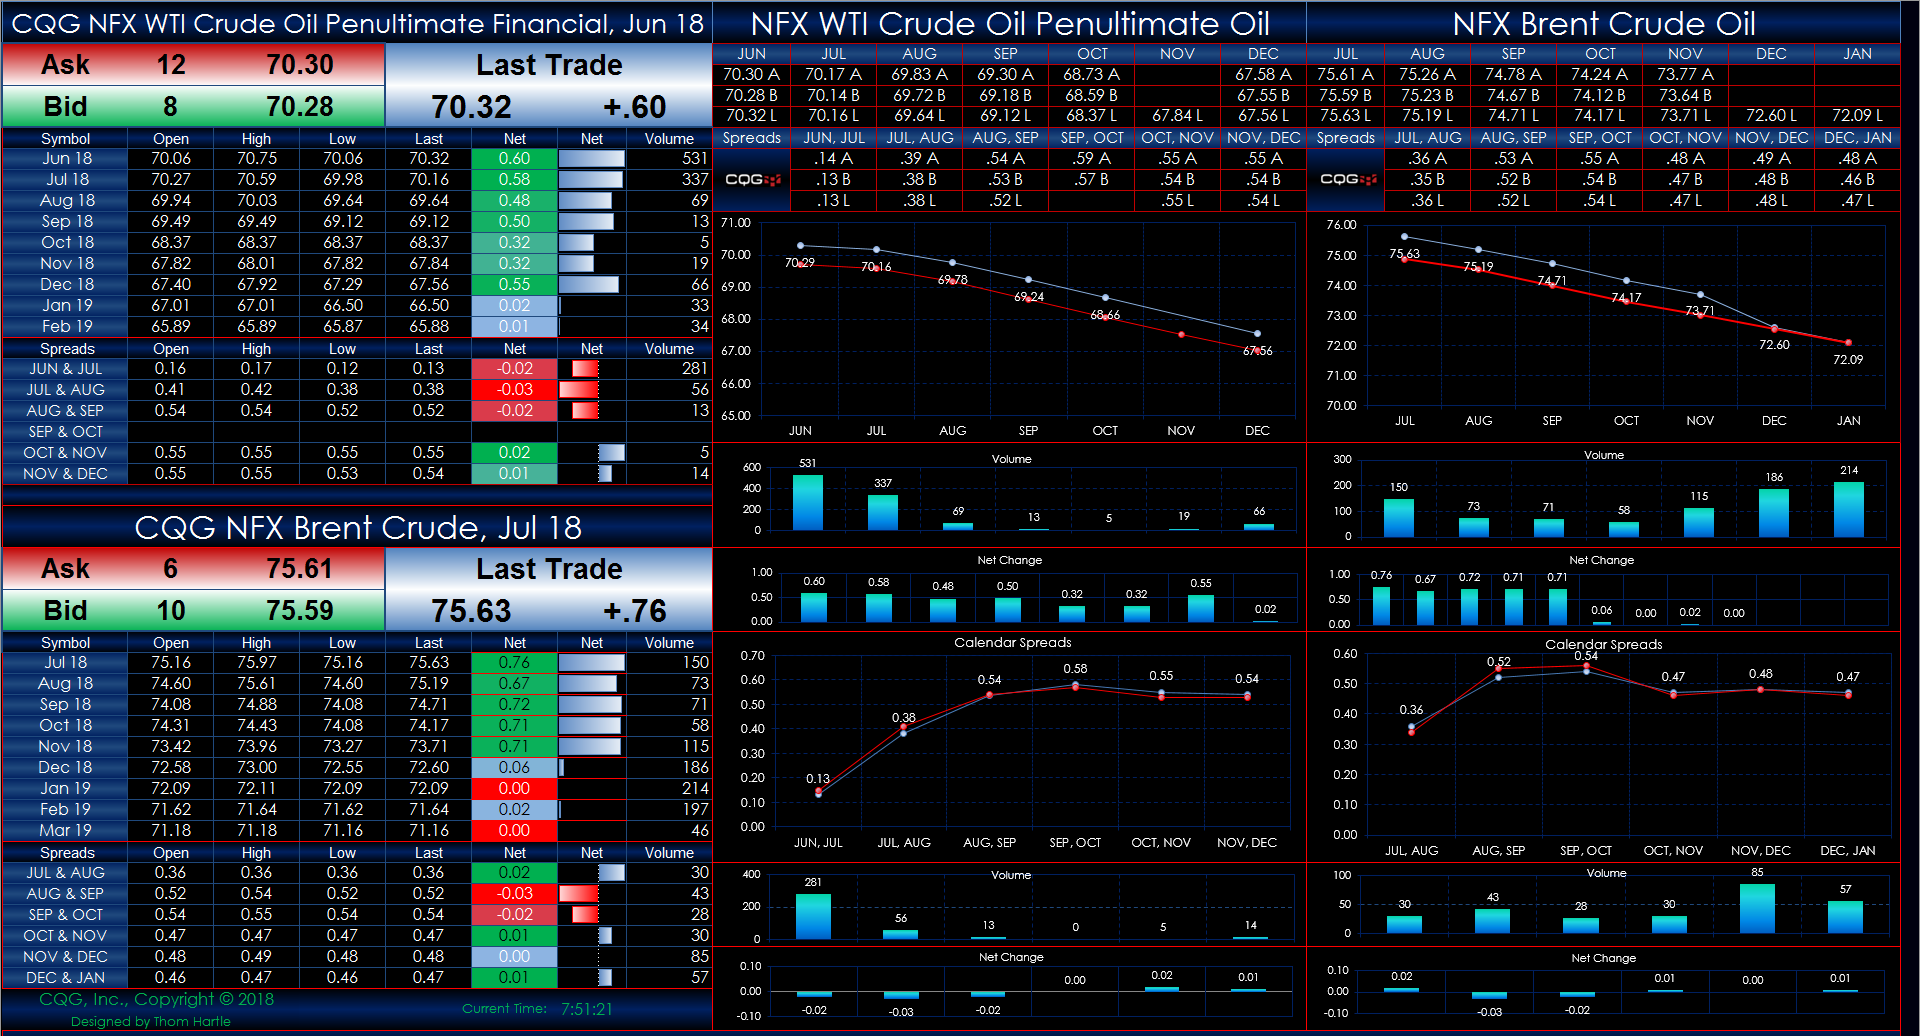
The forward curves display today's data. If the last price is outside of the best bid and best ask, then the mid-point between the best bid and best ask is used in the forward curve charts. The red line in the forward curve charts is the previous settlement. In addition, quote boards display market data for the two markets and one-month calendar spreads.

Downloads

Disclaimer

Trading and investment carry a high level of risk, and CQG, Inc. does not make any recommendations for buying or selling any financial instruments. We offer educational information on ways to use our sophisticated CQG trading tools, but it is up to our customers and other readers to make their own trading and investment decisions or to consult with a registered investment advisor. The opinions expressed here are solely those of the author and do not reflect the opinions of CQG, Inc. or its affiliates.