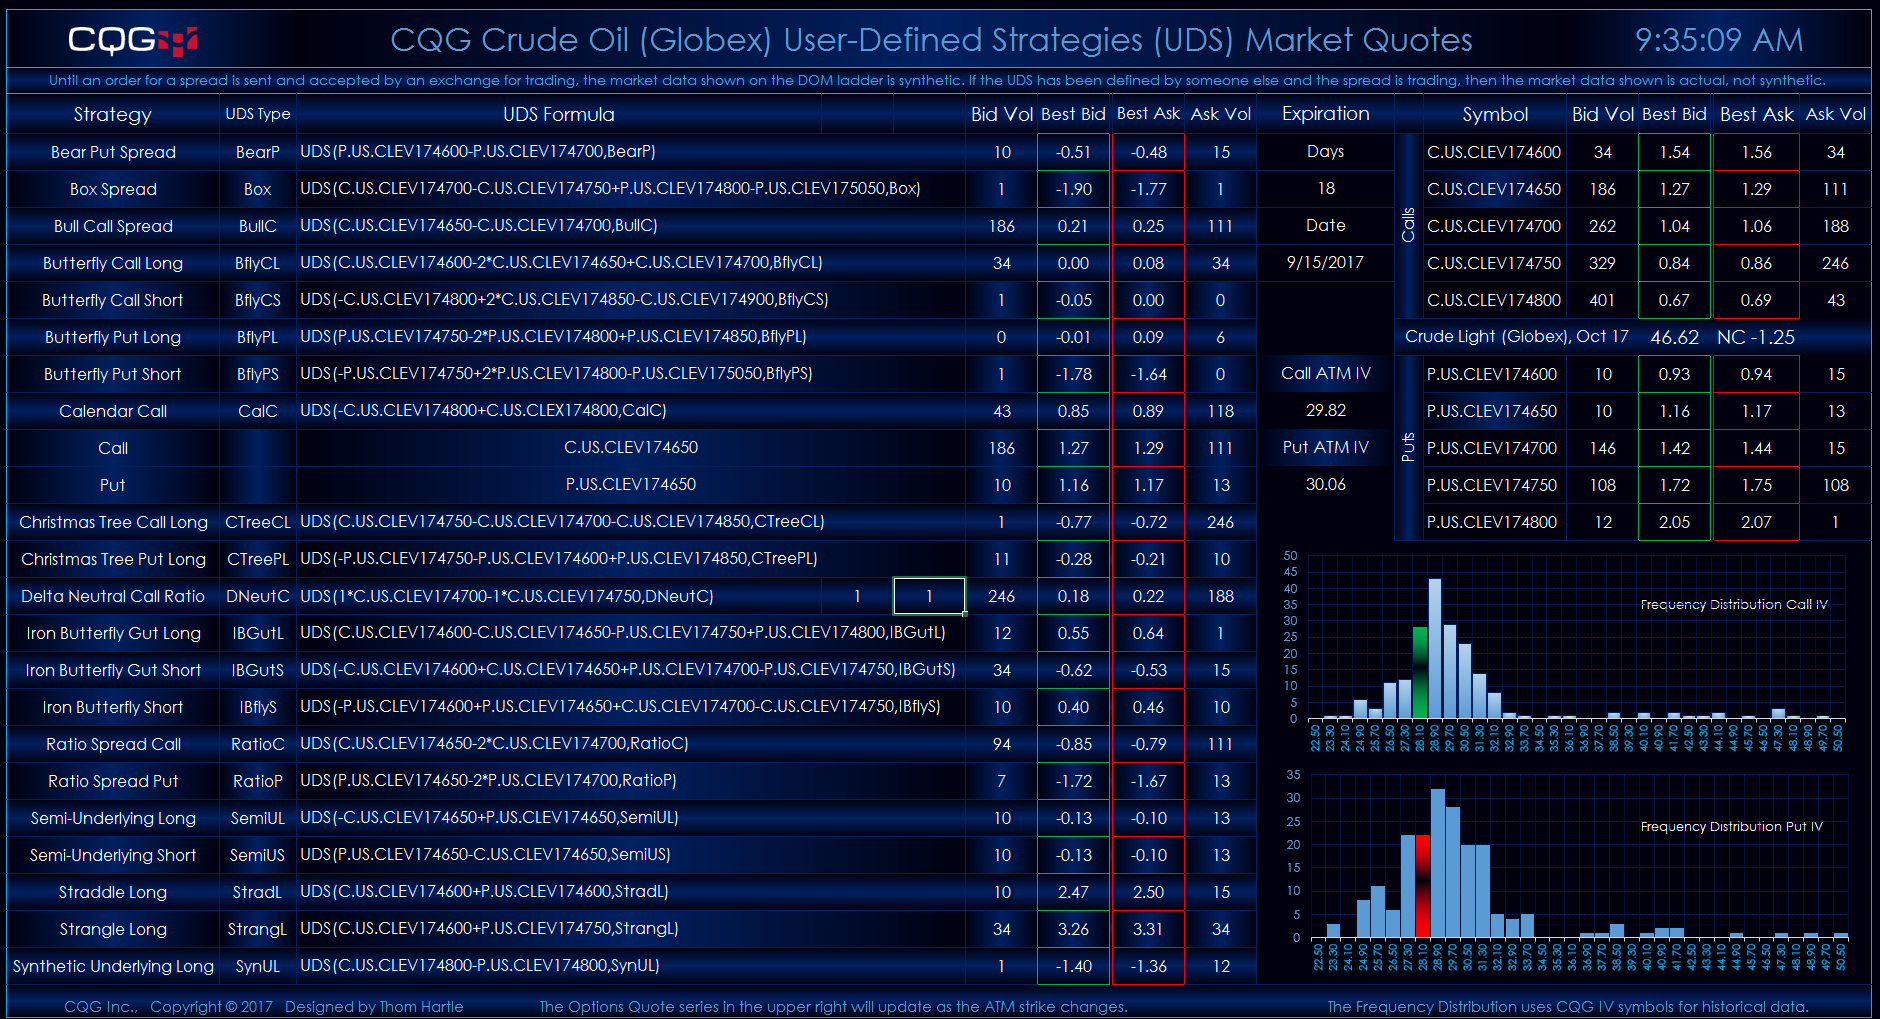
These two Microsoft Excel® dashboard display market quotes for tradable UDS for the crude oil contract and the E-mini S&P 500 traded on Globex. There is also a quote display with at-… more
Energy

This Microsoft Excel® spreadsheet presents Globex crude oil market data and forward curves. The data includes outrights, exchange-traded calendar spreads, and butterfly spreads. The exchange-… more
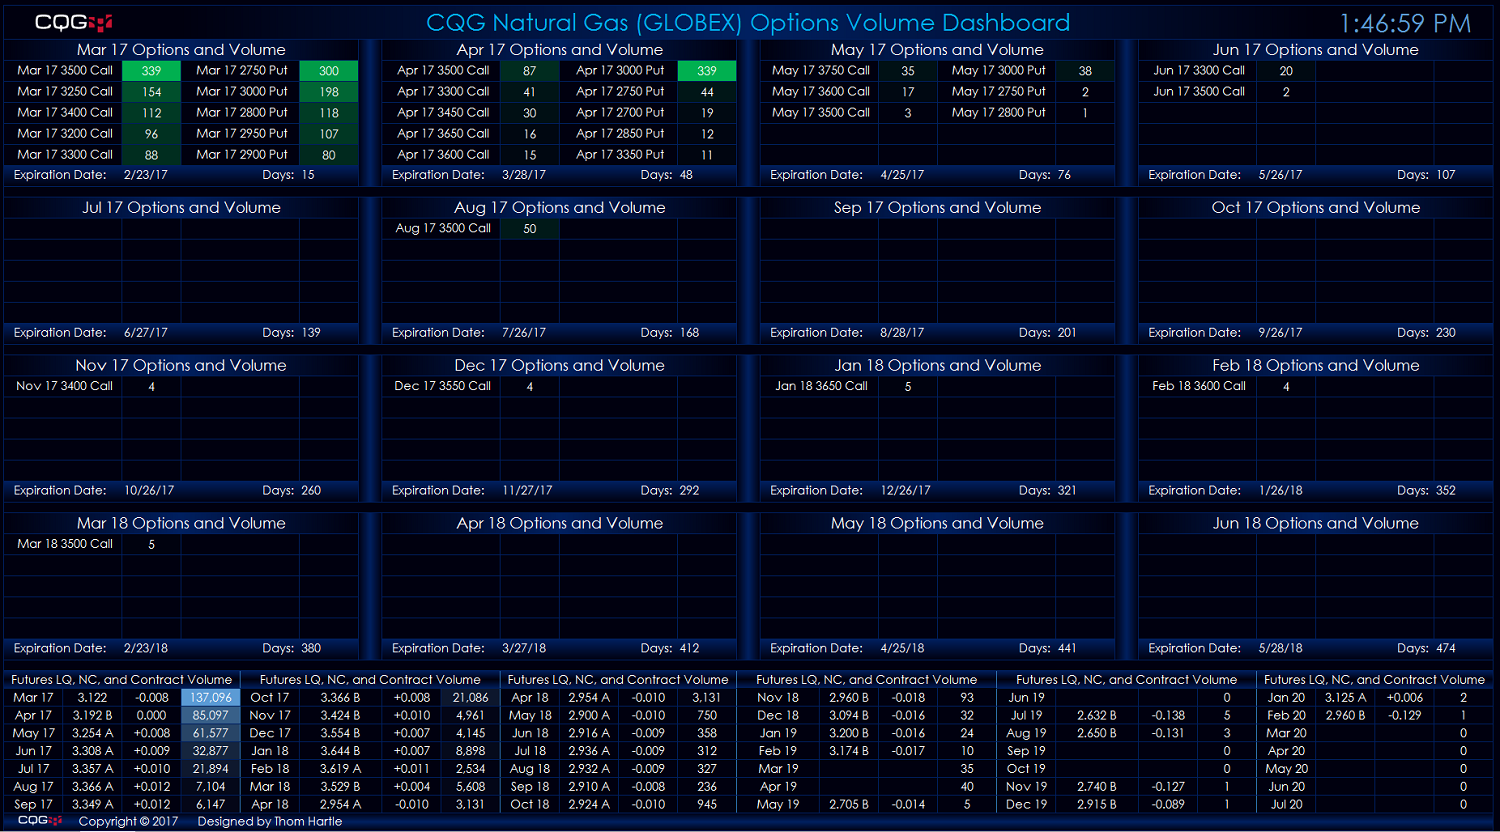
This Microsoft Excel® dashboard scans the options on the natural gas (Globex) futures market for volume and ranks the volume traded for each expiry out sixteen months. The scan covers options… more
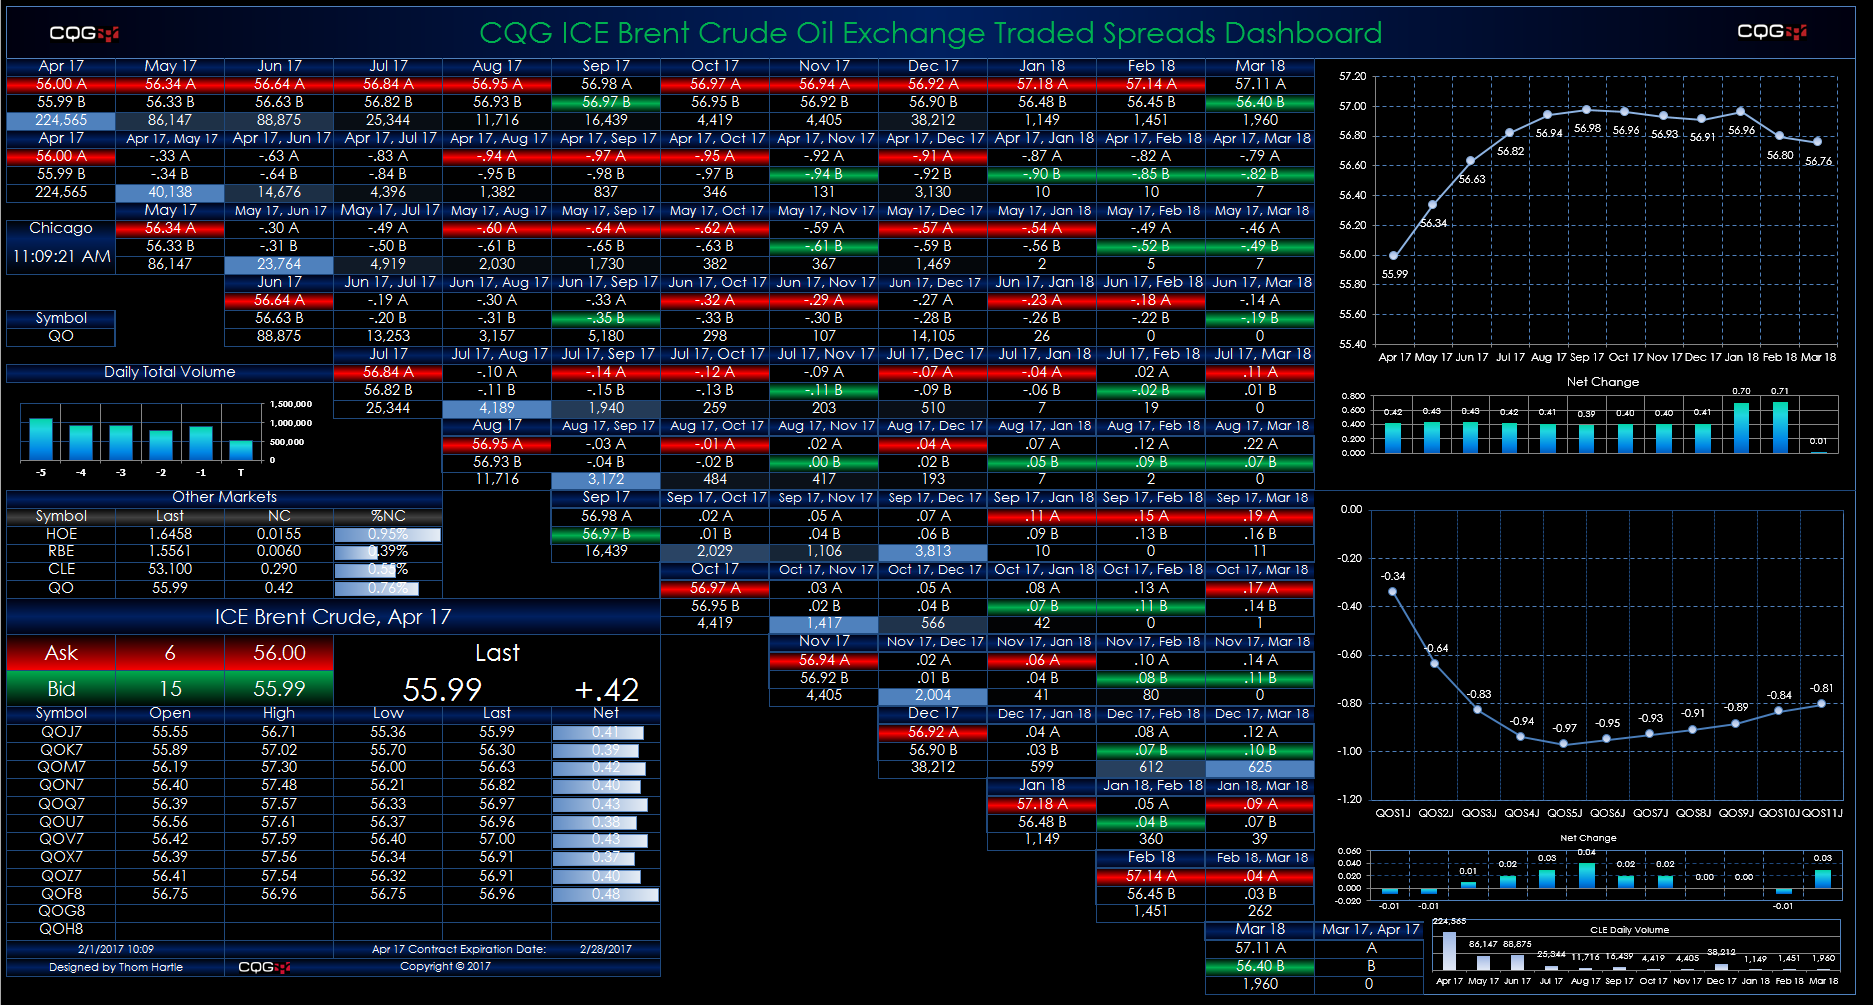
This Microsoft Excel® dashboard displays market data for crude oil spreads traded on the ICE platform using a matrix-style format. The outrights are along the top row and the start of each… more
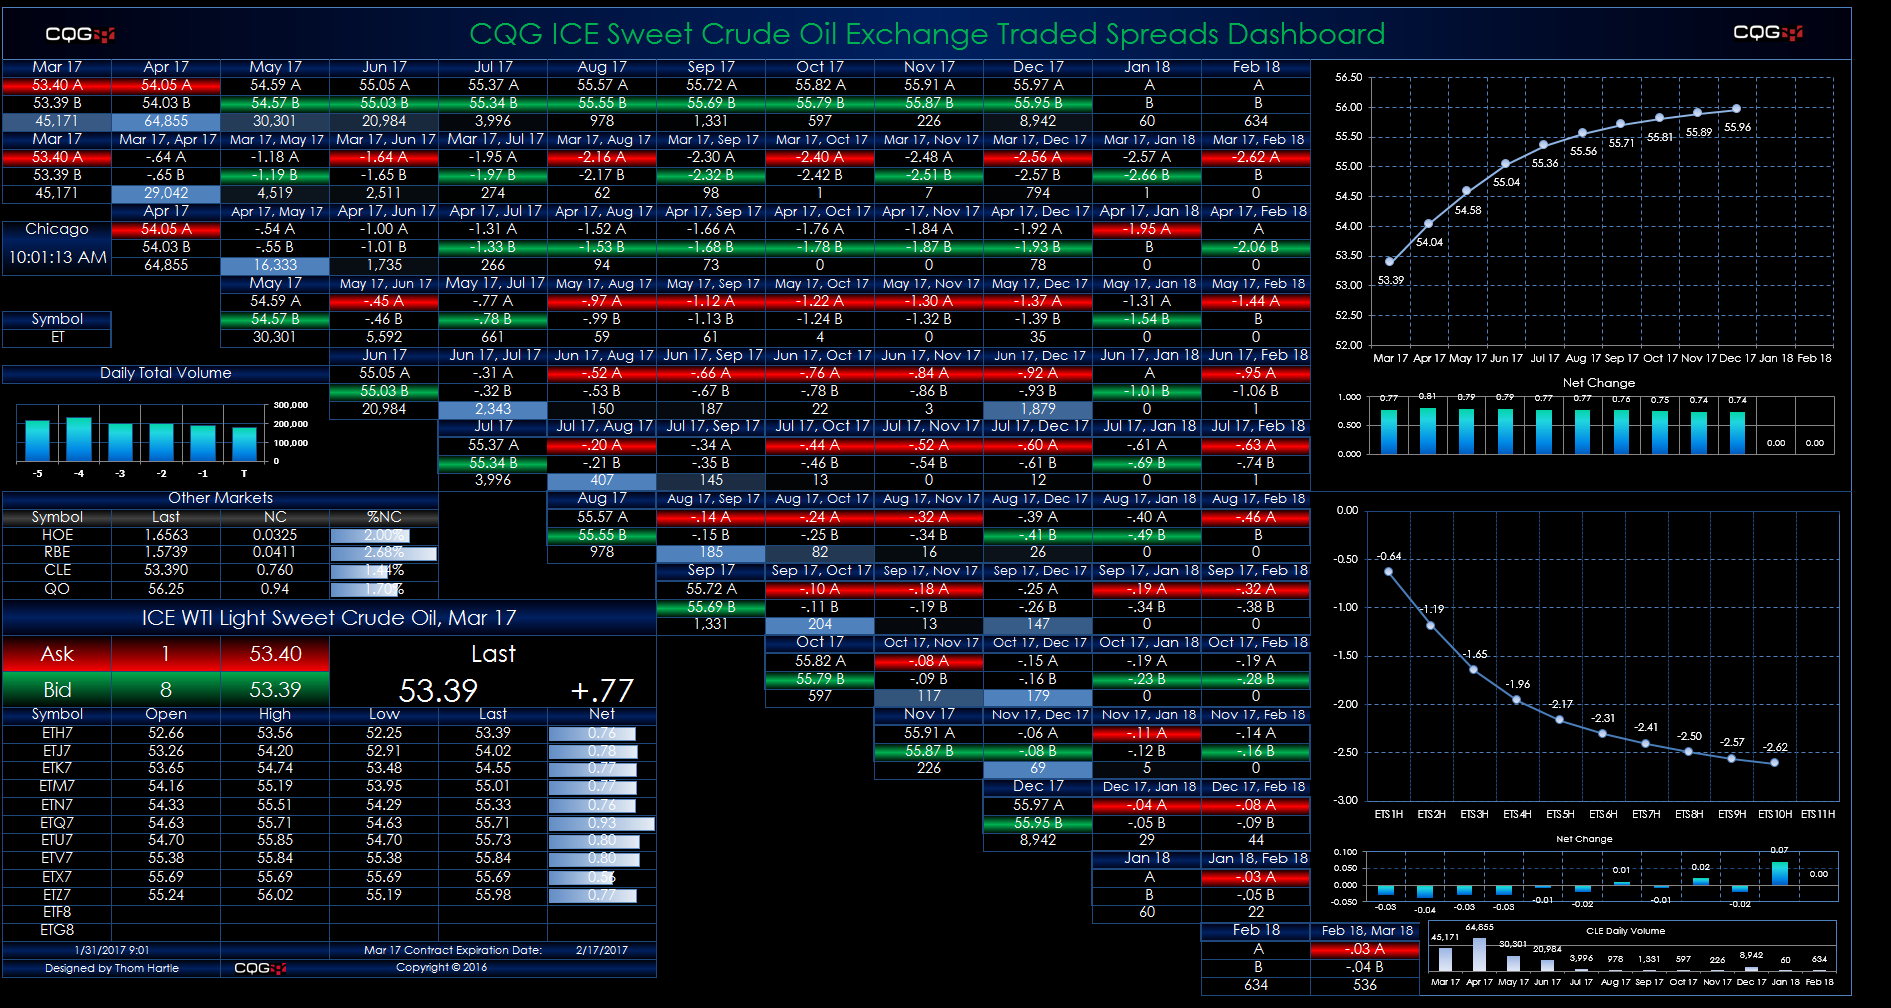
This Microsoft Excel® dashboard displays market data for crude oil spreads traded on the ICE platform using a matrix-style format. The outrights are along the top row and the start of each… more
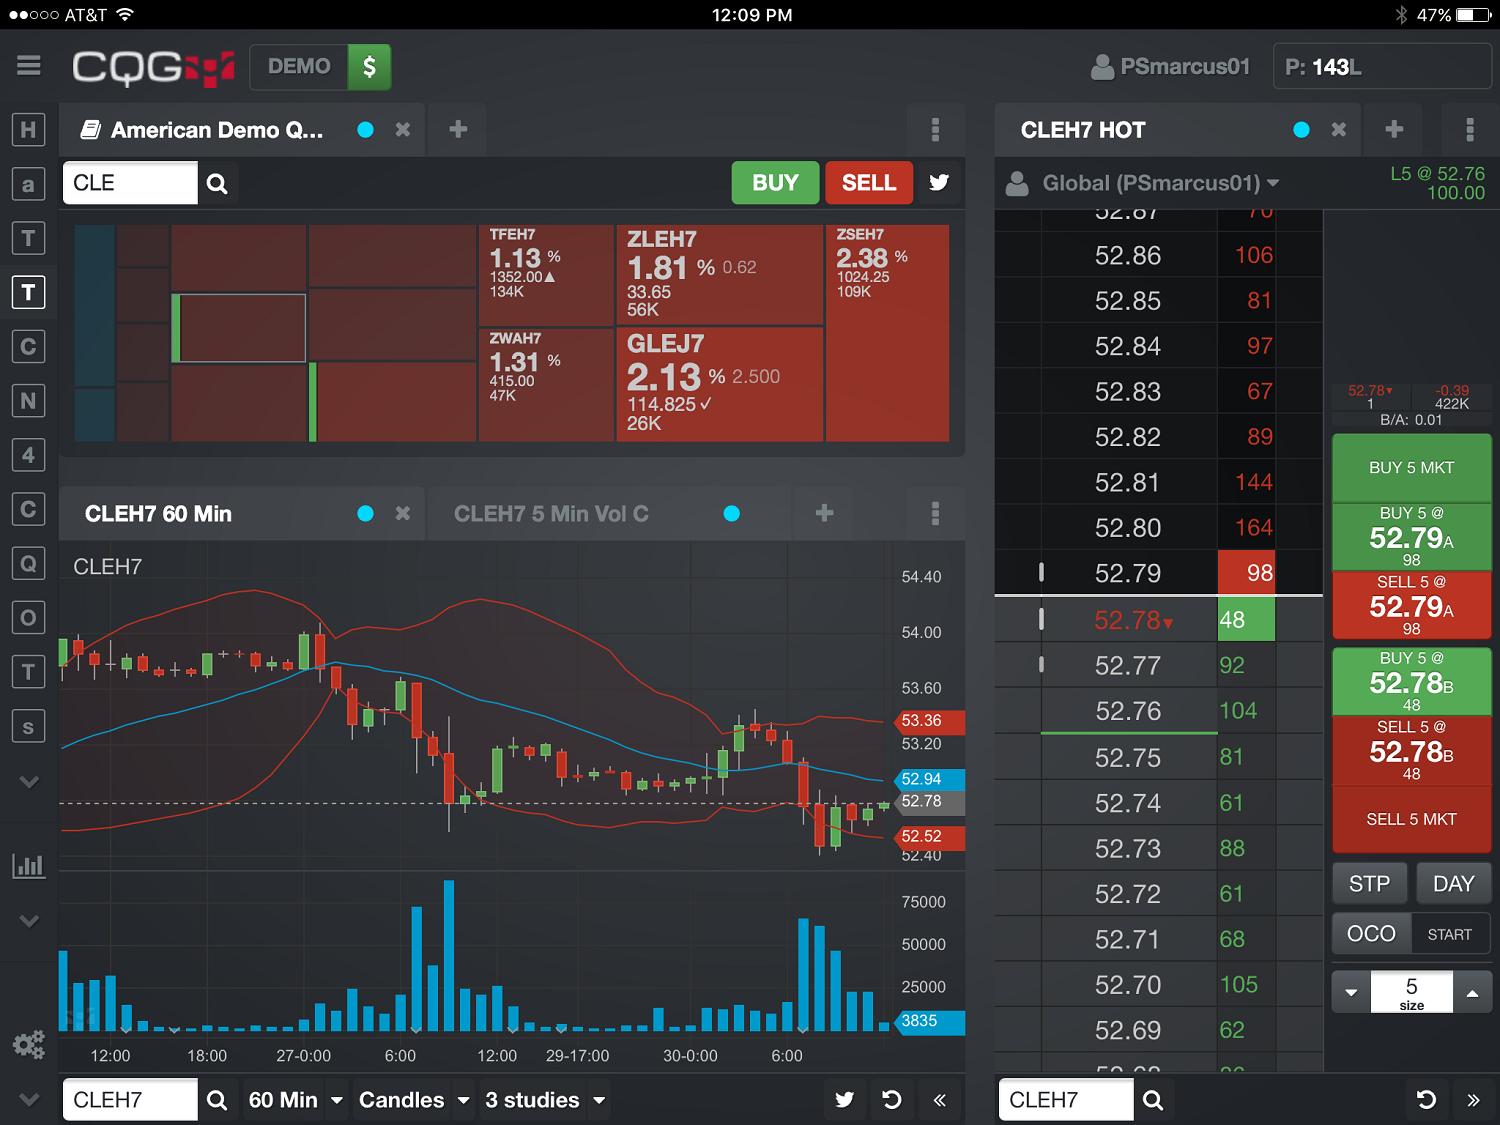
This CQG M dashboard layout displays a portfolio of symbols from the Americas (available with a subscription to the CME Globex feed on CQG) in a heat-map style. Tapping on a quote pushes the… more
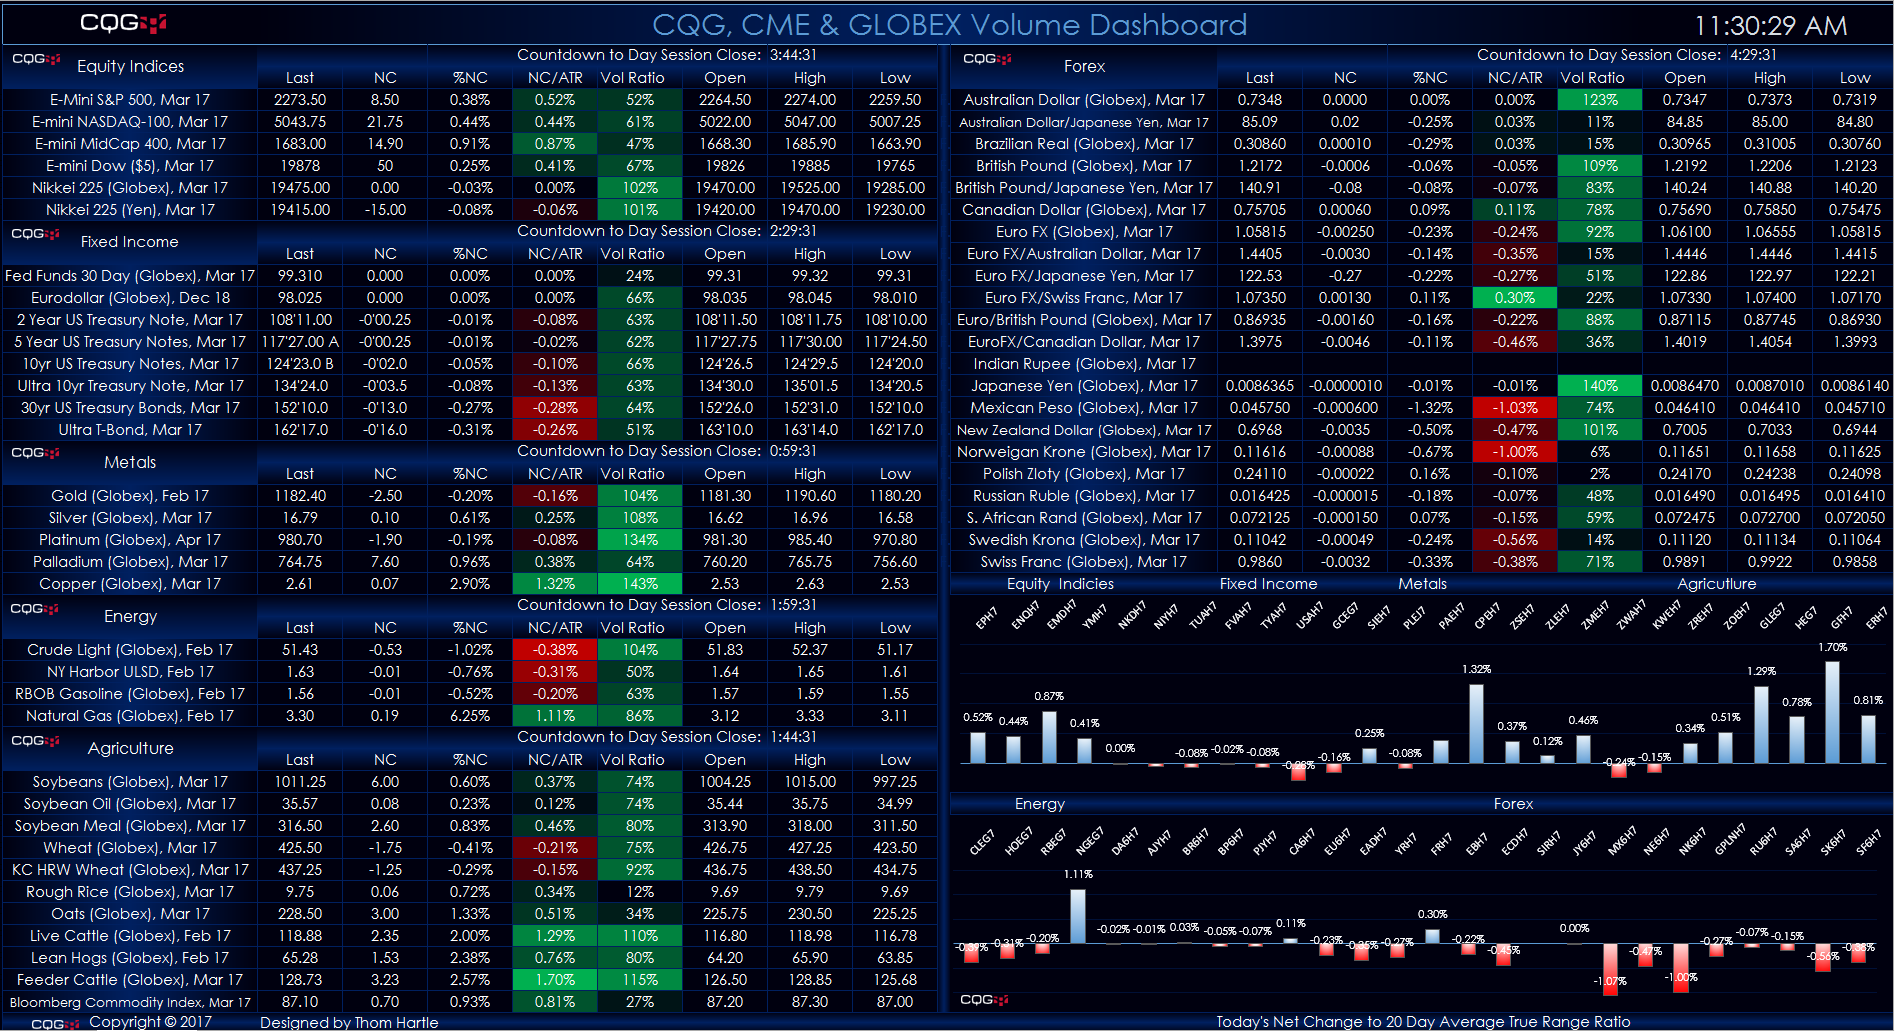
This Microsoft Excel® dashboard displays key market information for contracts traded on the CME Exchange and the Globex platform. The markets are grouped by these products:
Equity Indices… more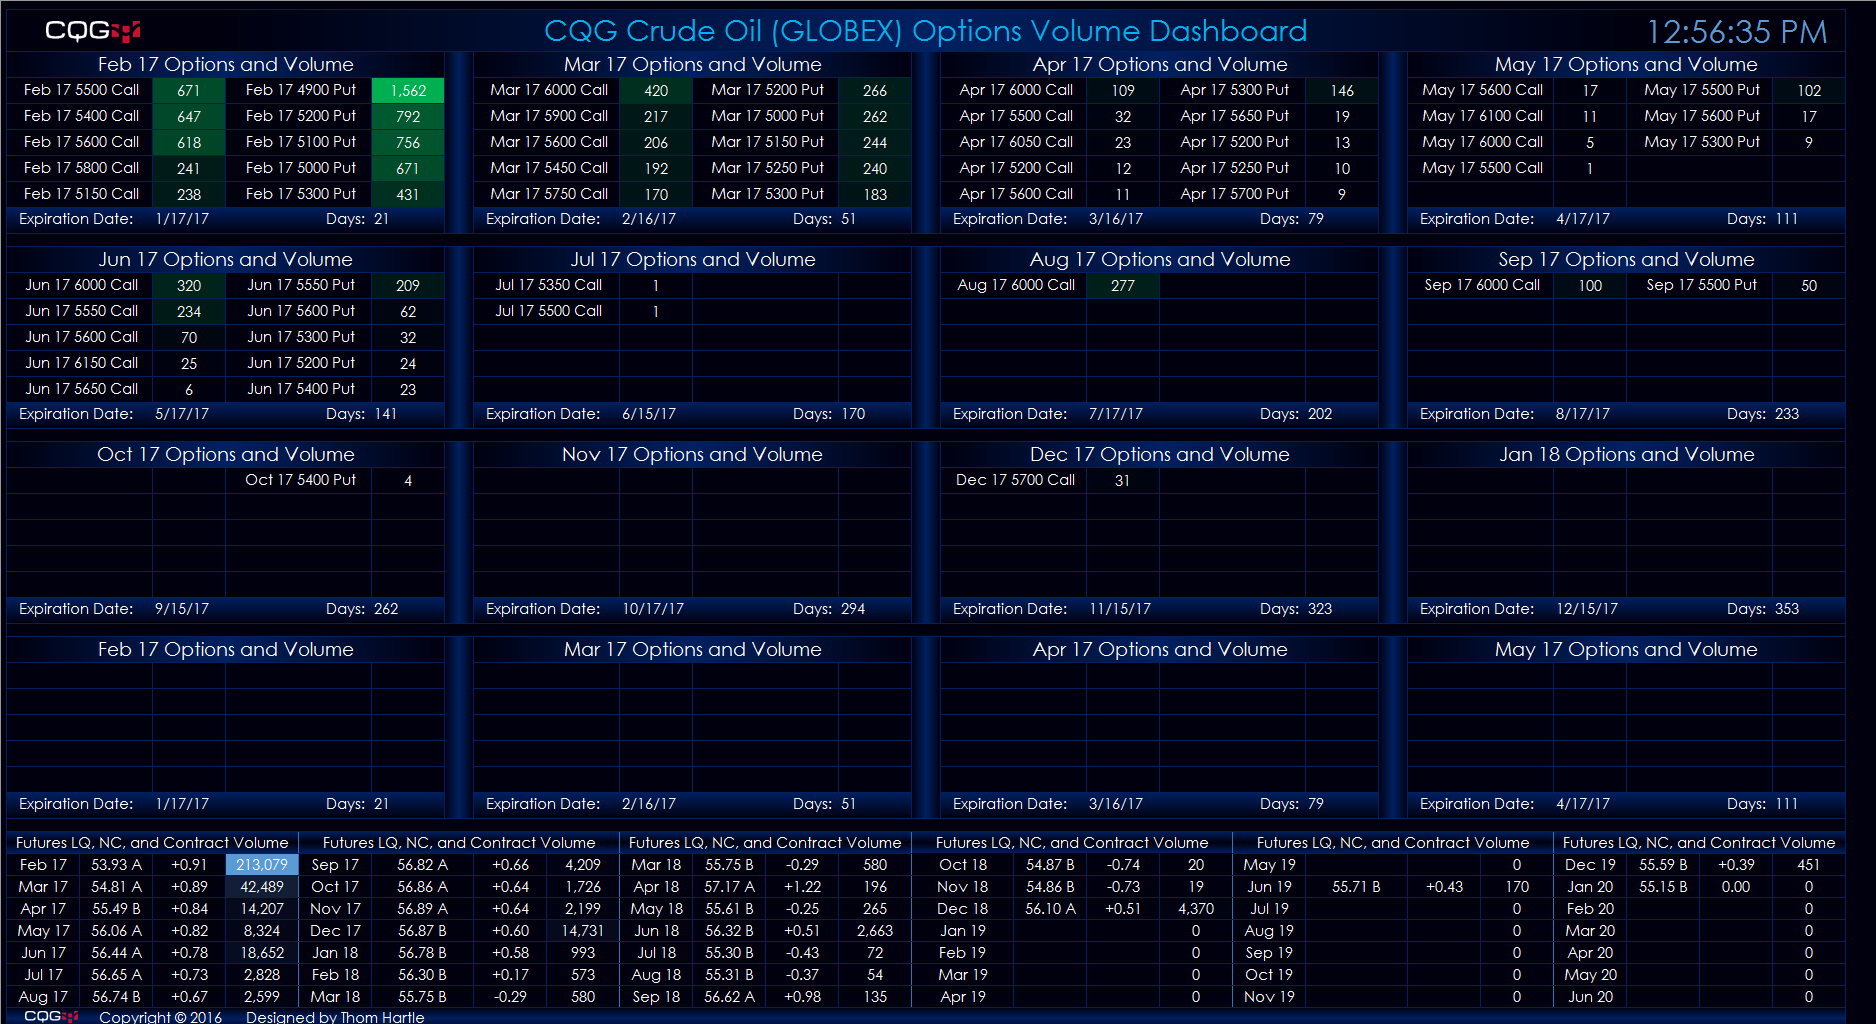
This Microsoft Excel® dashboard scans the crude oil (GLOBEX) futures market options for volume and ranks the traded volume for each expiry out to sixteen months. The scan covers options… more
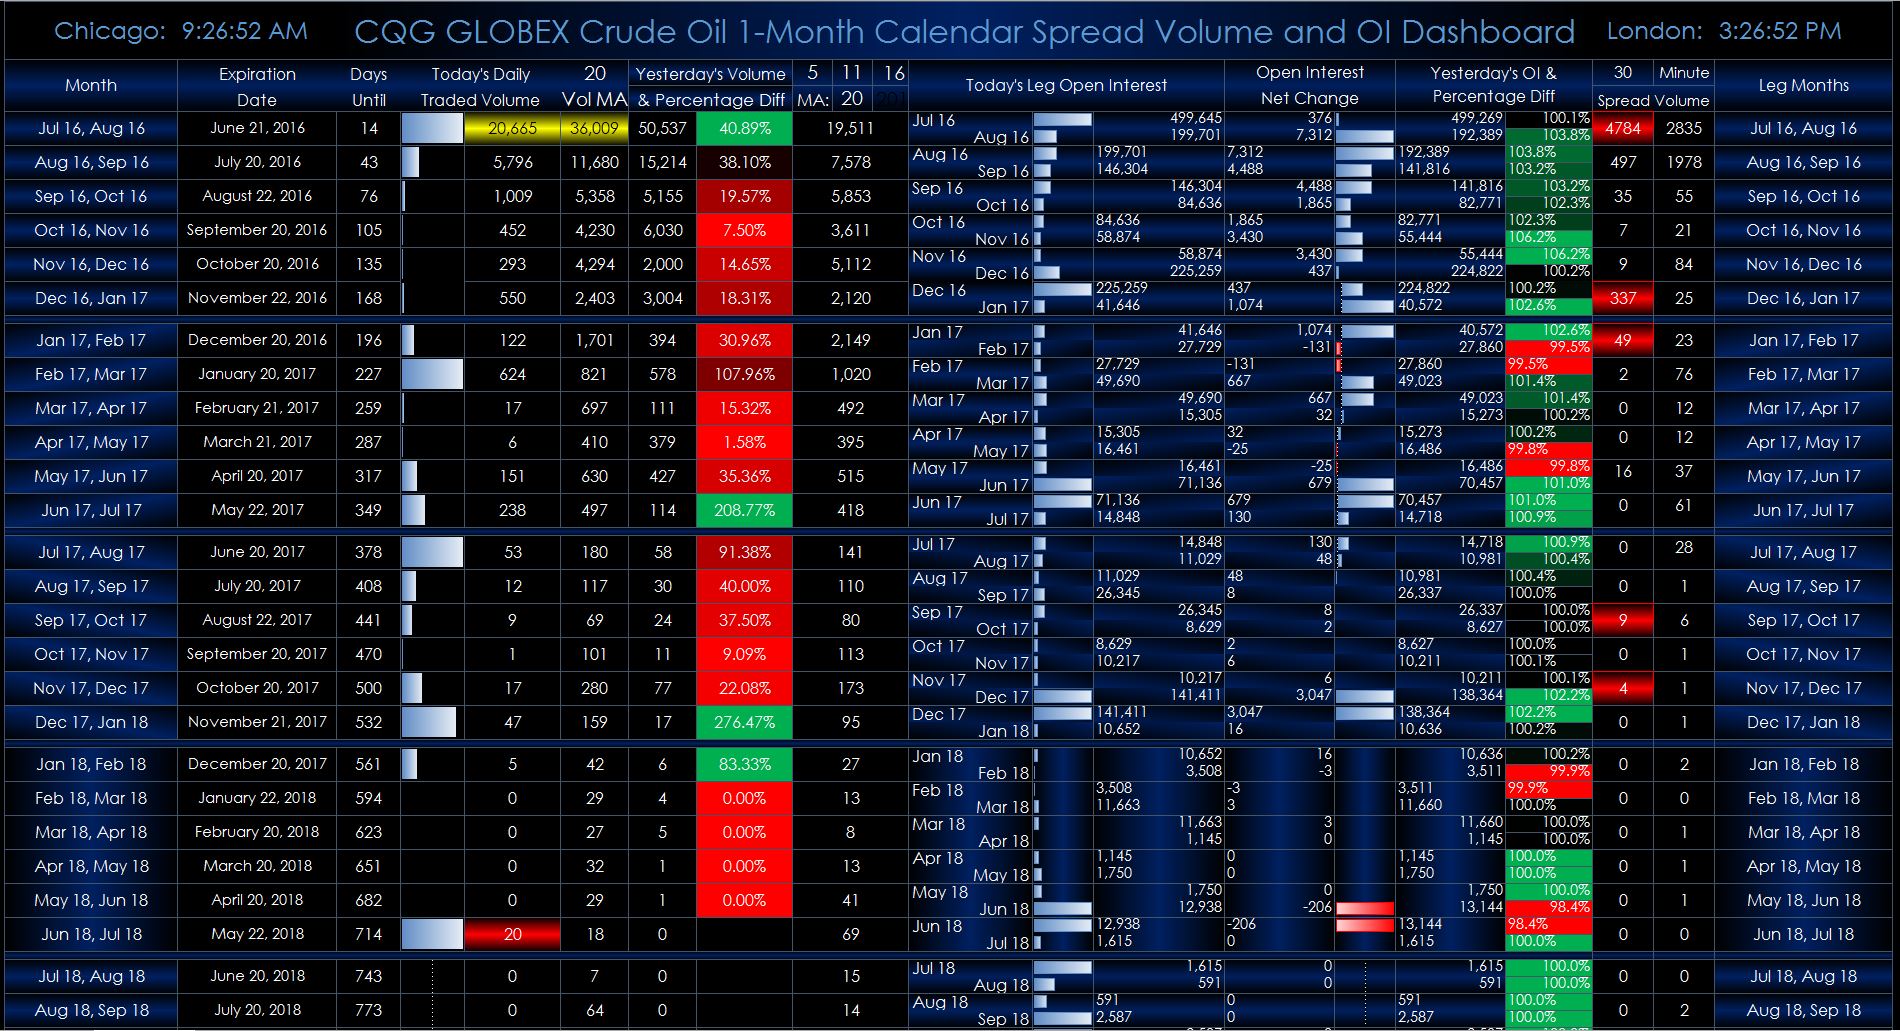
This Microsoft Excel® dashboard displays individual one-month crude oil calendar spreads traded on CME Globex and their individual legs for tracking the volume and open interest rolls. All of… more
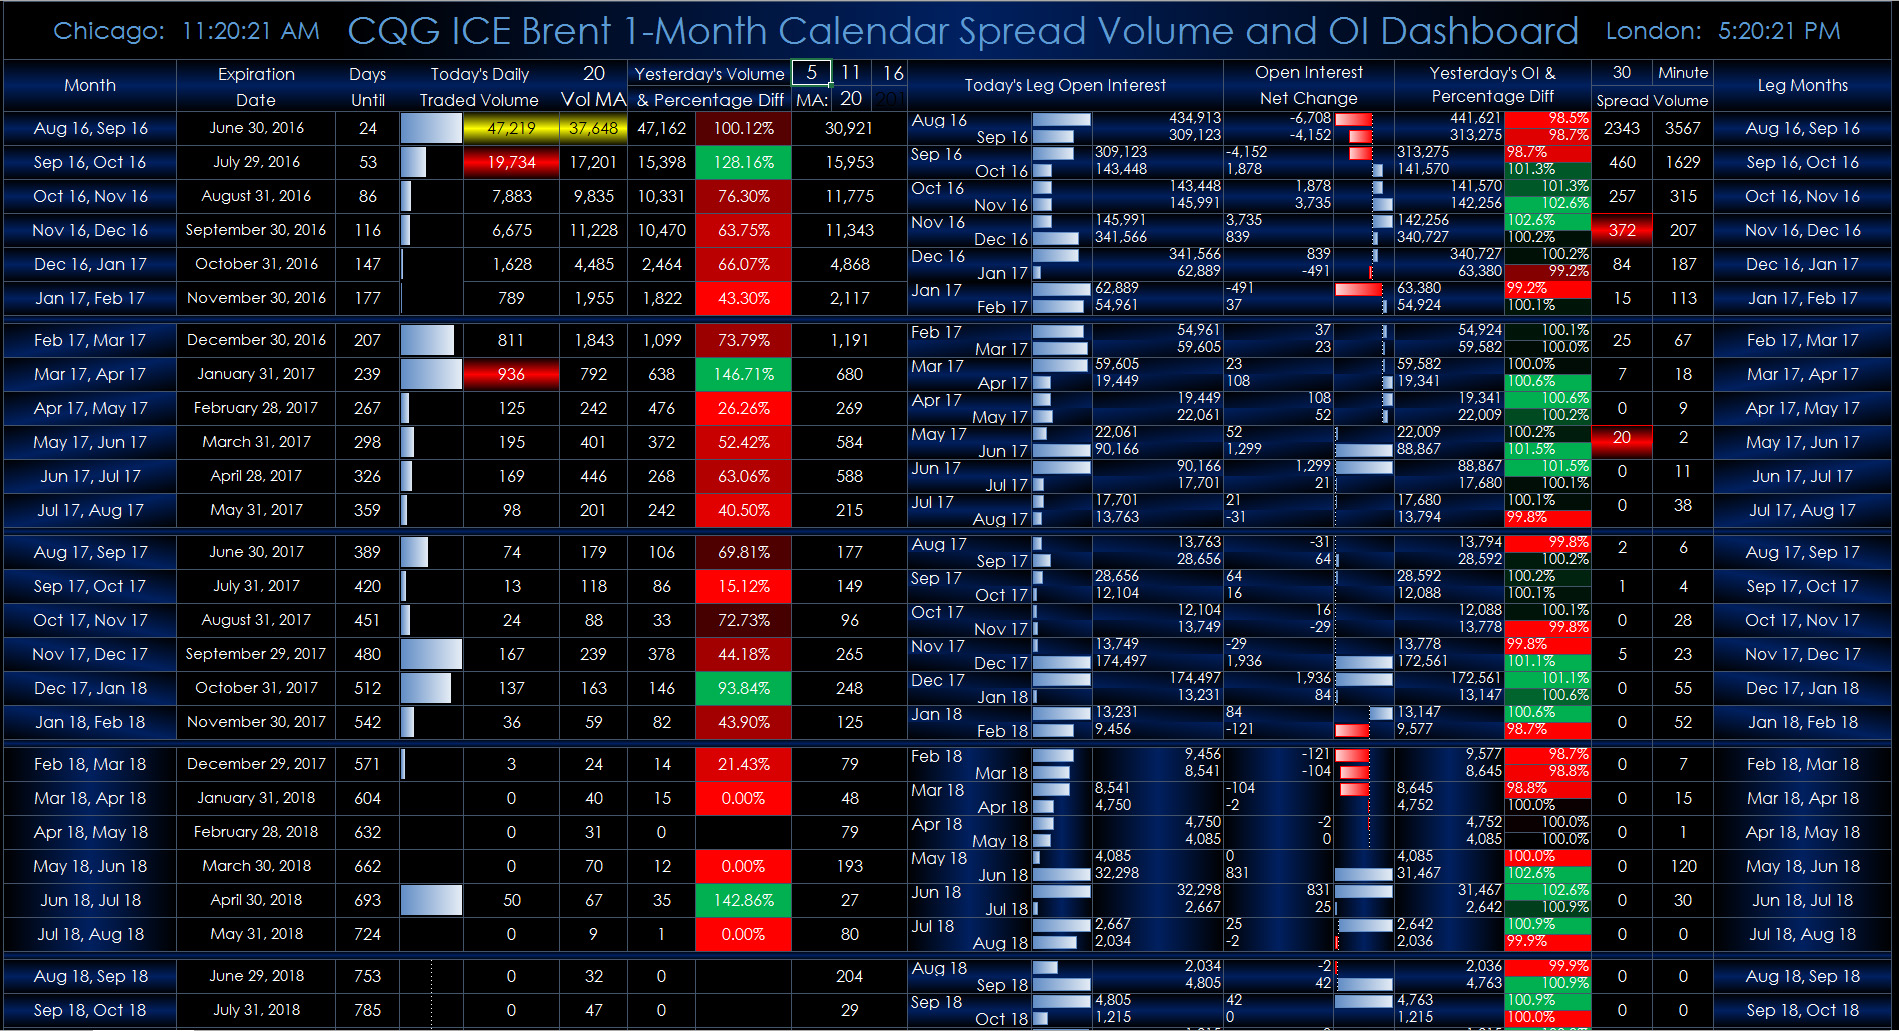
This Microsoft Excel® dashboard displays individual one-month Brent crude oil calendar spreads and their individual legs for tracking the volume and open interest rolls. All of the active… more