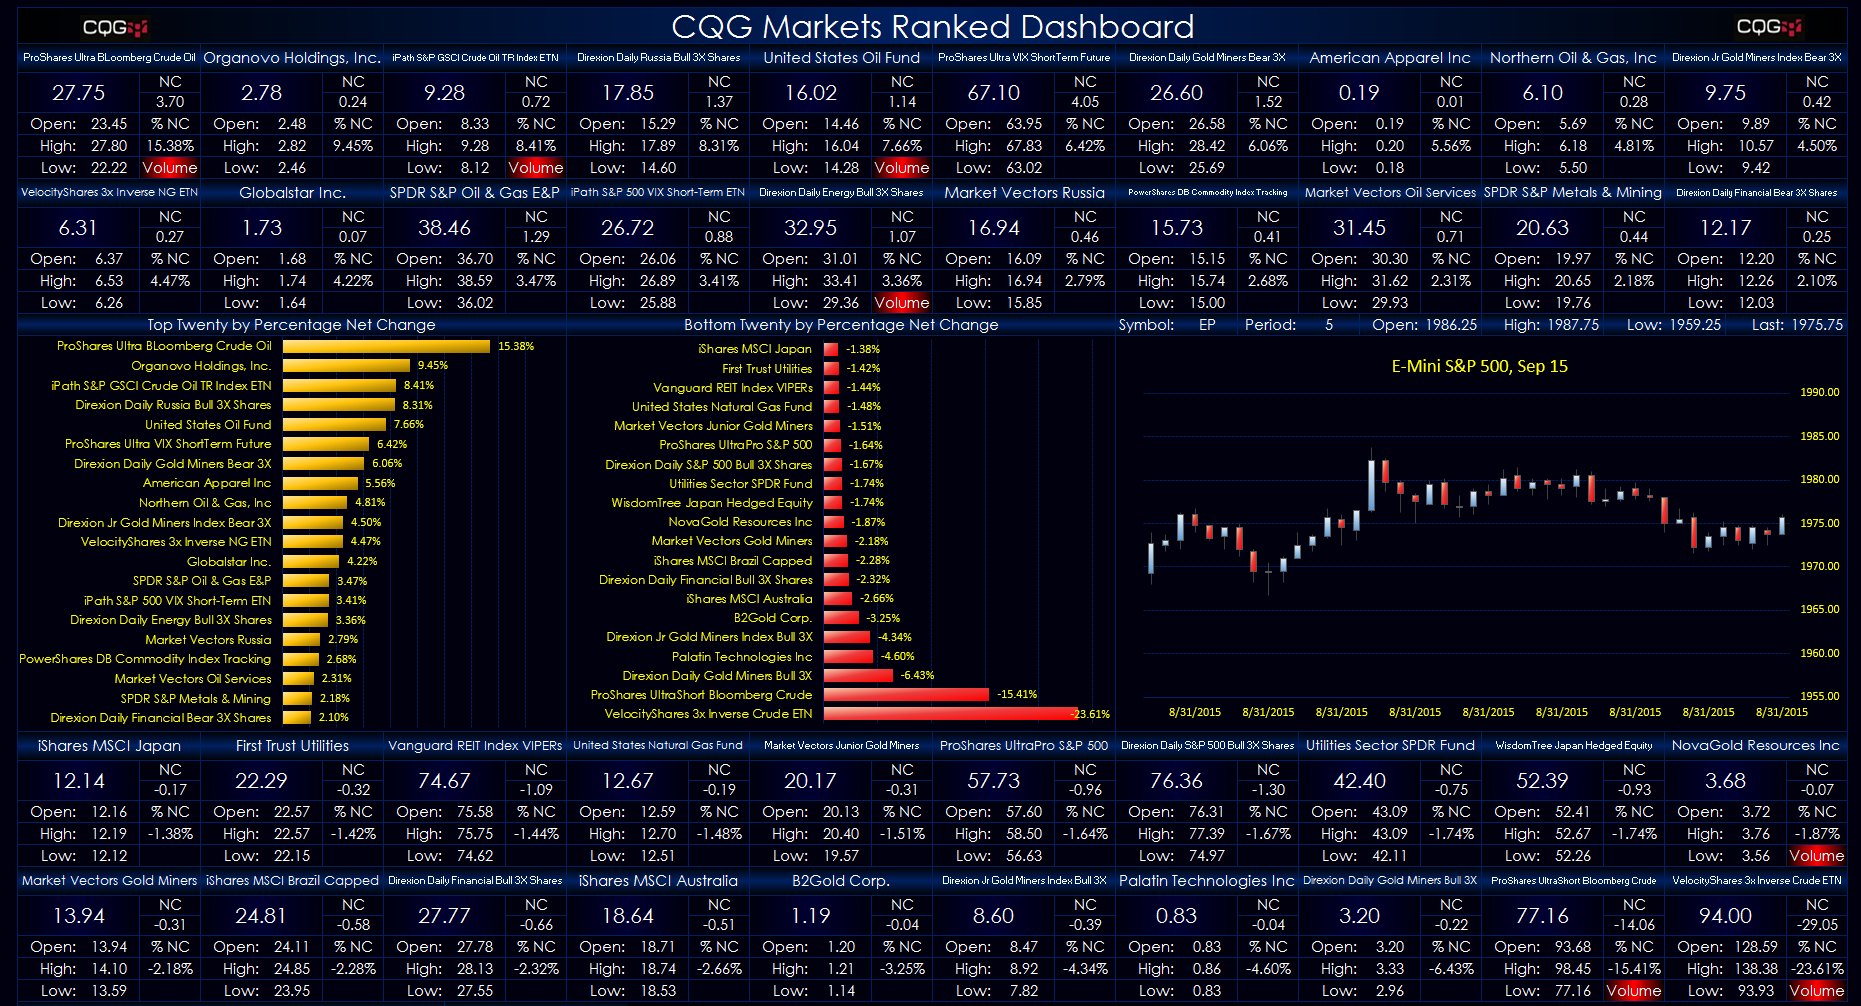
This Microsoft Excel® spreadsheet is a modified version of the Dynamically Ranked SPDR® ETFs Dashboard. This version allows you to enter in the symbols you want using the symbols tab. The top twenty performing markets, on a percent change basis, are automatically displayed in the top two rows of market data information and the left-hand histogram bar chart. The bottom twenty performing markets, on a percent change basis, are automatically displayed in the bottom two rows of market data information and the right-hand histogram bar chart. In addition, if the current traded volume exceeds the ten-day moving average of the volume, then a volume red alert appears in the quote display.
Also, you can enter in a symbol and time frame for a current forty-bar candlestick chart.
Requires CQG Integrated Client or CQG QTrader, data enablement for the NYSE, and Excel 2013 or more recent.