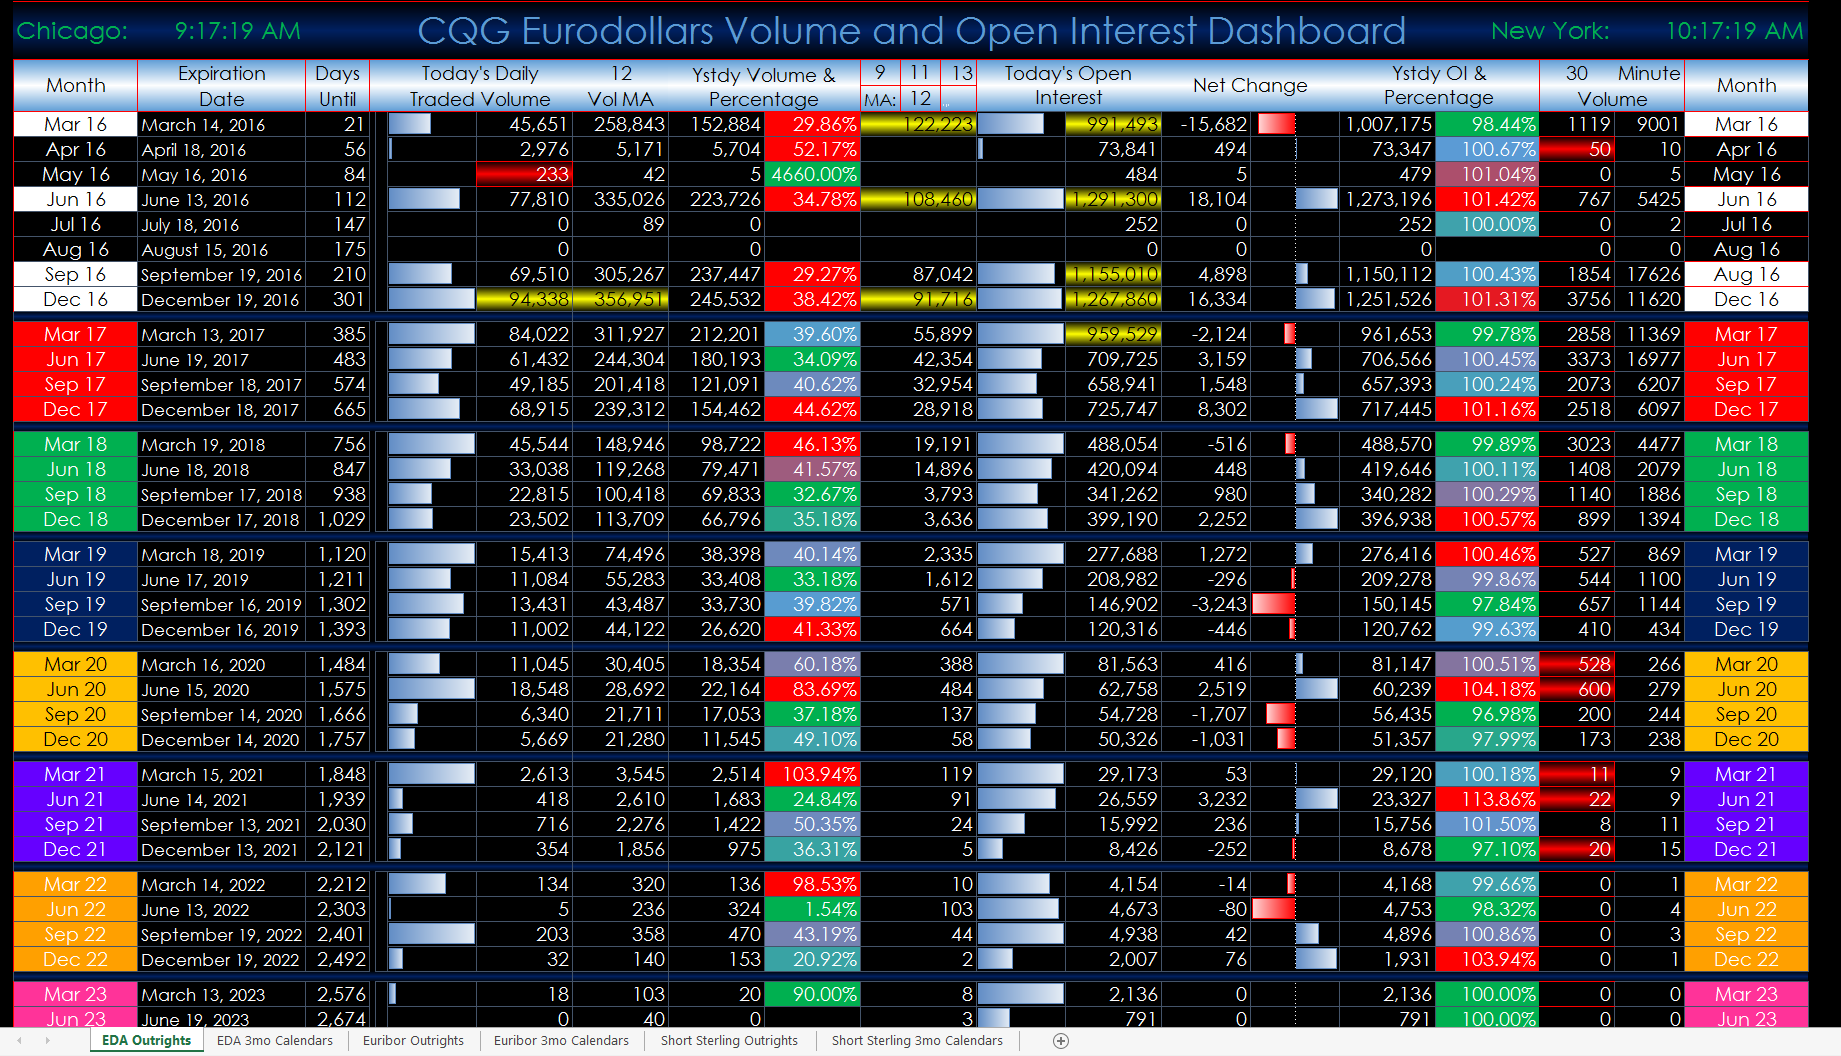
This Microsoft Excel® dashboard displays both outrights and individual three-month calendar spreads and their individual legs for tracking the rolls. The markets covered are the Globex-traded… more
Thom Hartle

This Microsoft Excel® dashboard displays individual Euribor 3-month calendar spreads and their individual legs for tracking the rolls. All of the active deliveries for each individual symbol are… more
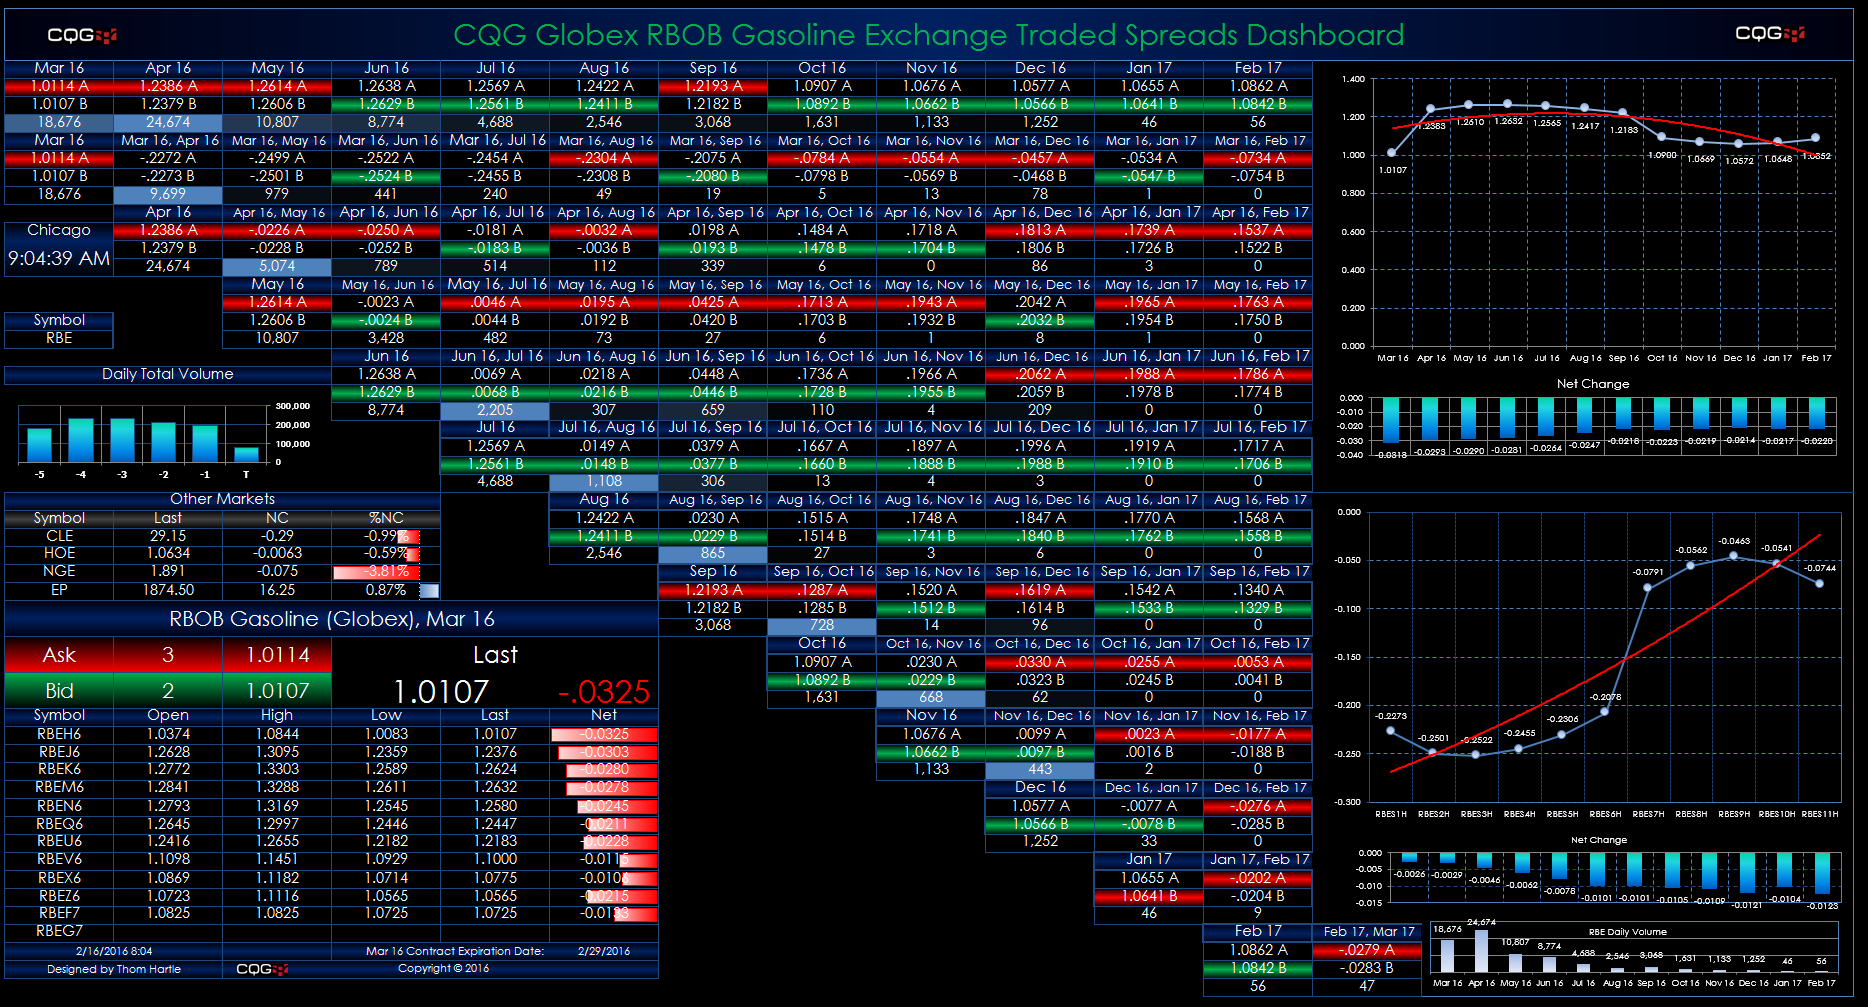
This Microsoft Excel® dashboard displays market data for RBOB Gasoline spreads traded on the CME Globex platform. This monitor uses a matrix style format. The outrights are along the top row and… more
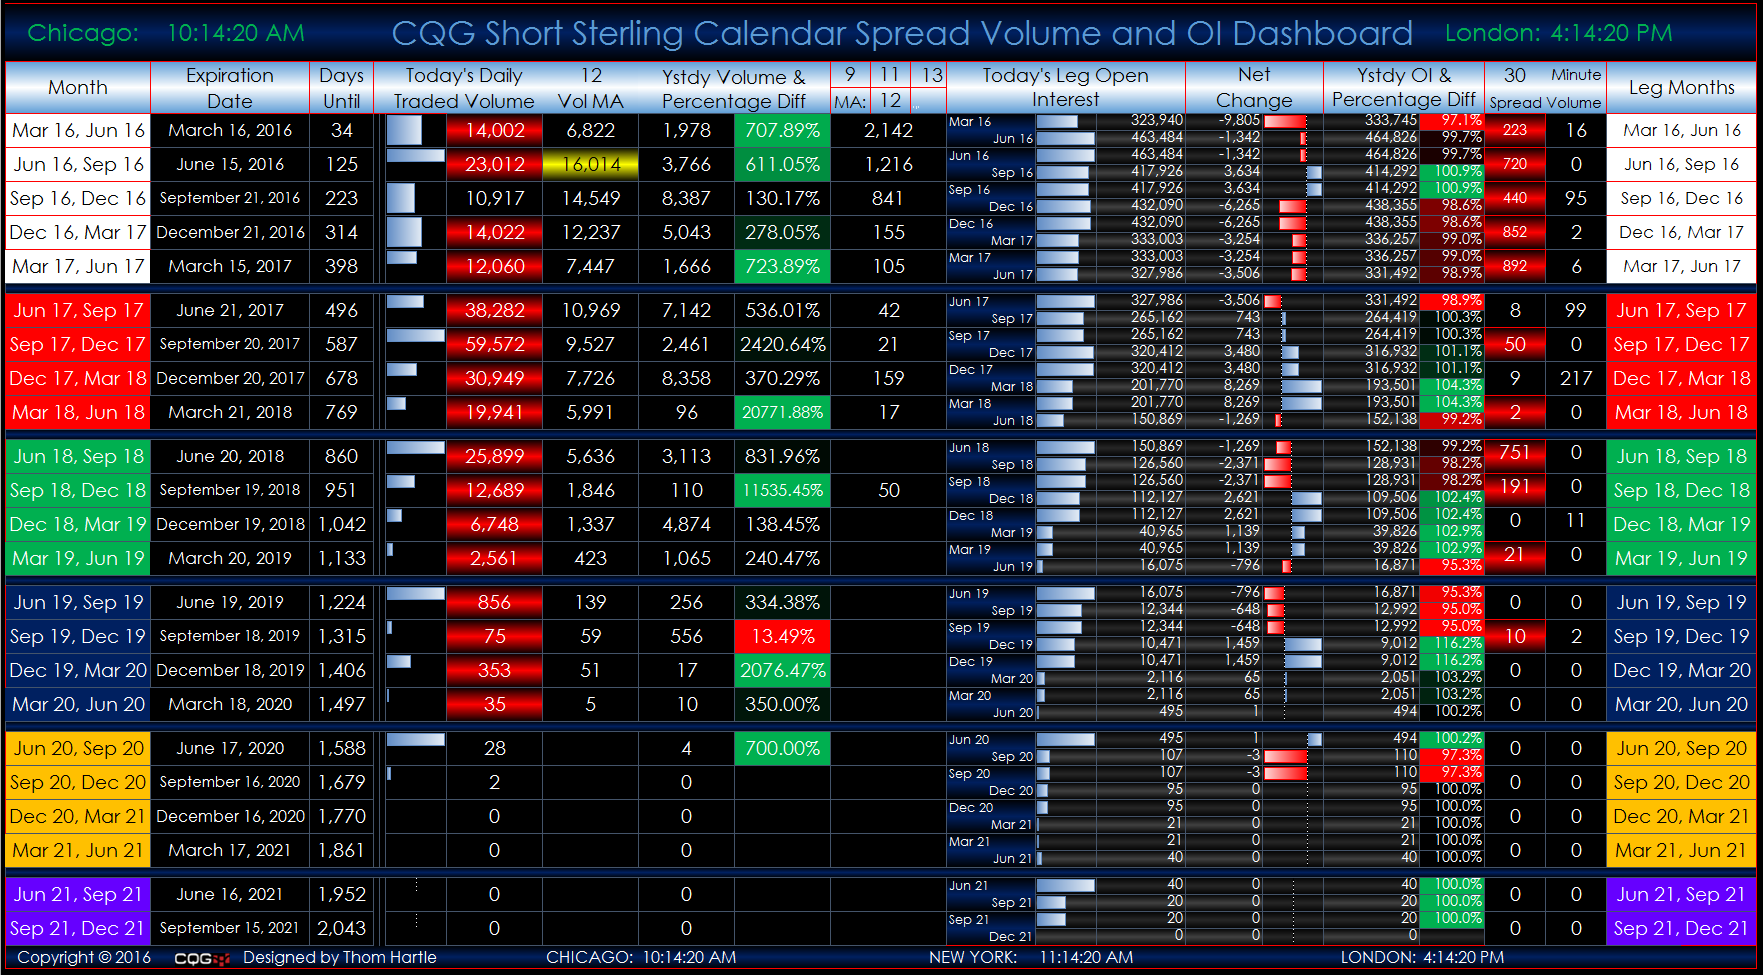
This Microsoft Excel® dashboard displays individual Short Sterling three-month calendar spreads and their individual legs for tracking the rolls. All of the active deliveries for each individual… more
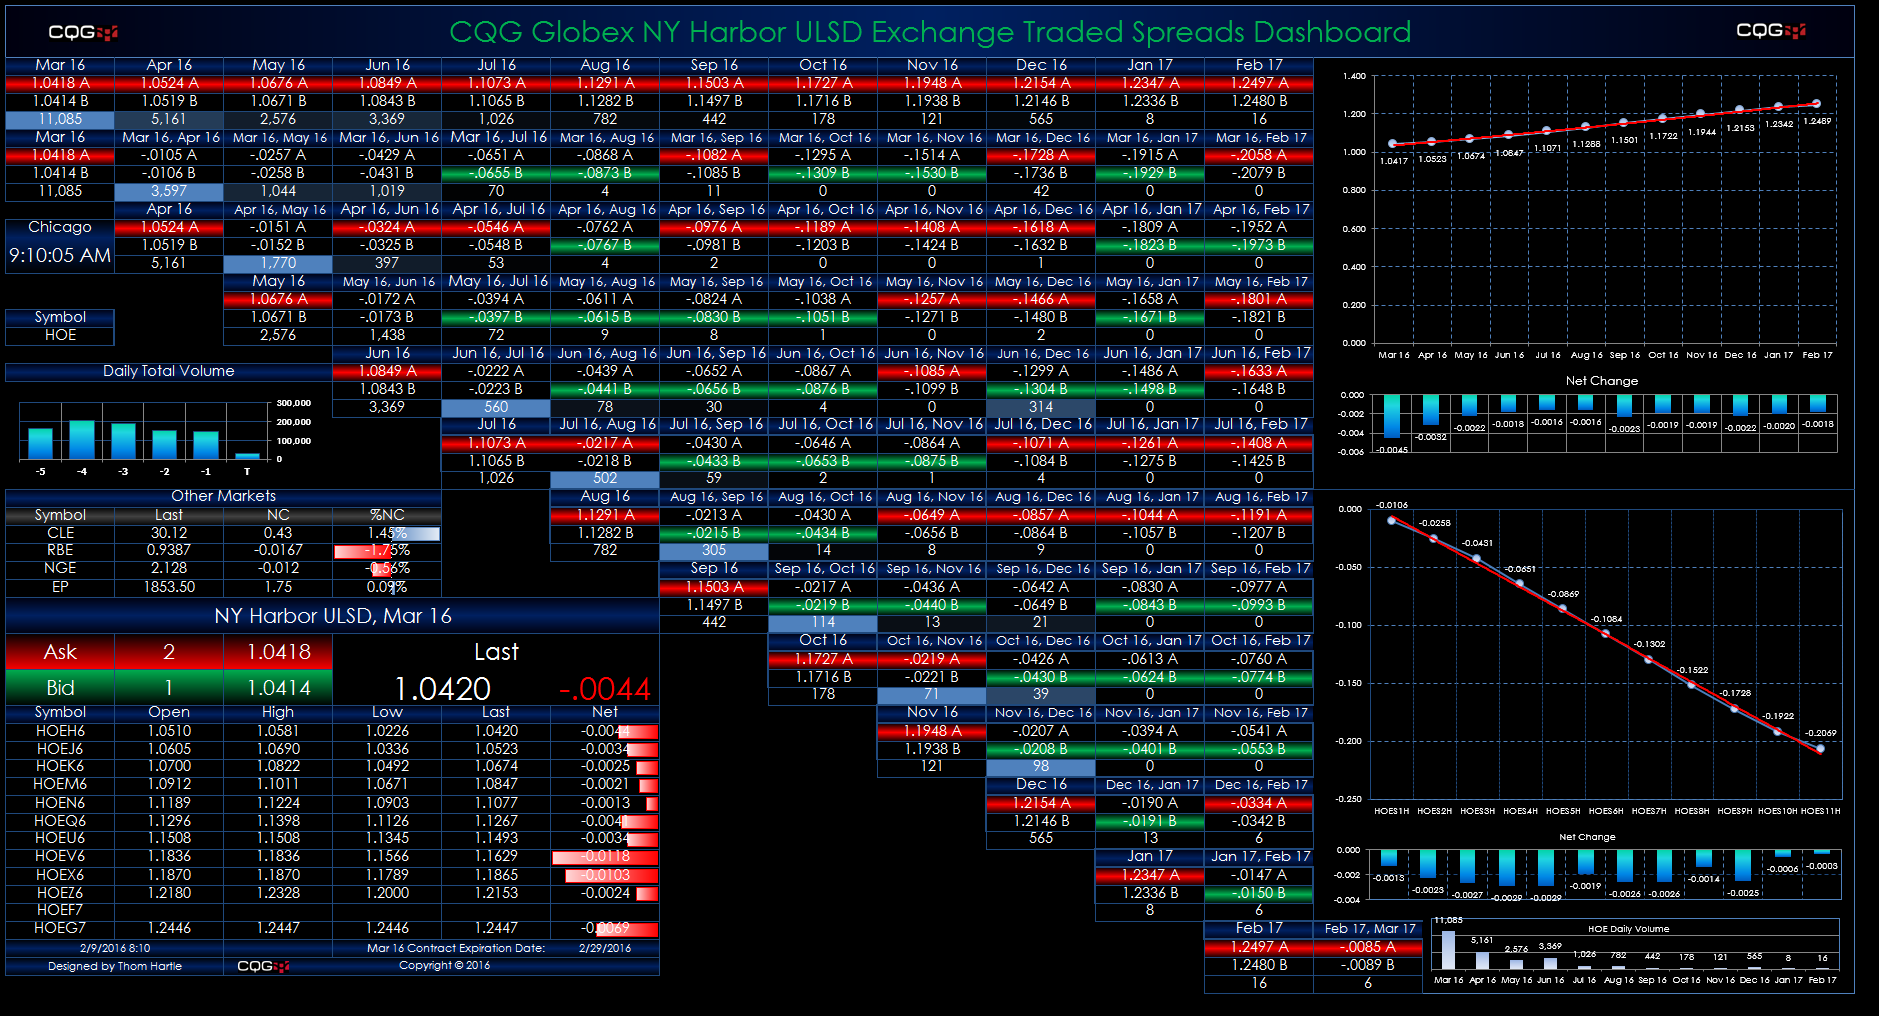
This Microsoft Excel® dashboard displays market data for heating oil spreads traded on the CME Globex platform. This monitor uses a matrix style format. The outrights are along the top row and the… more
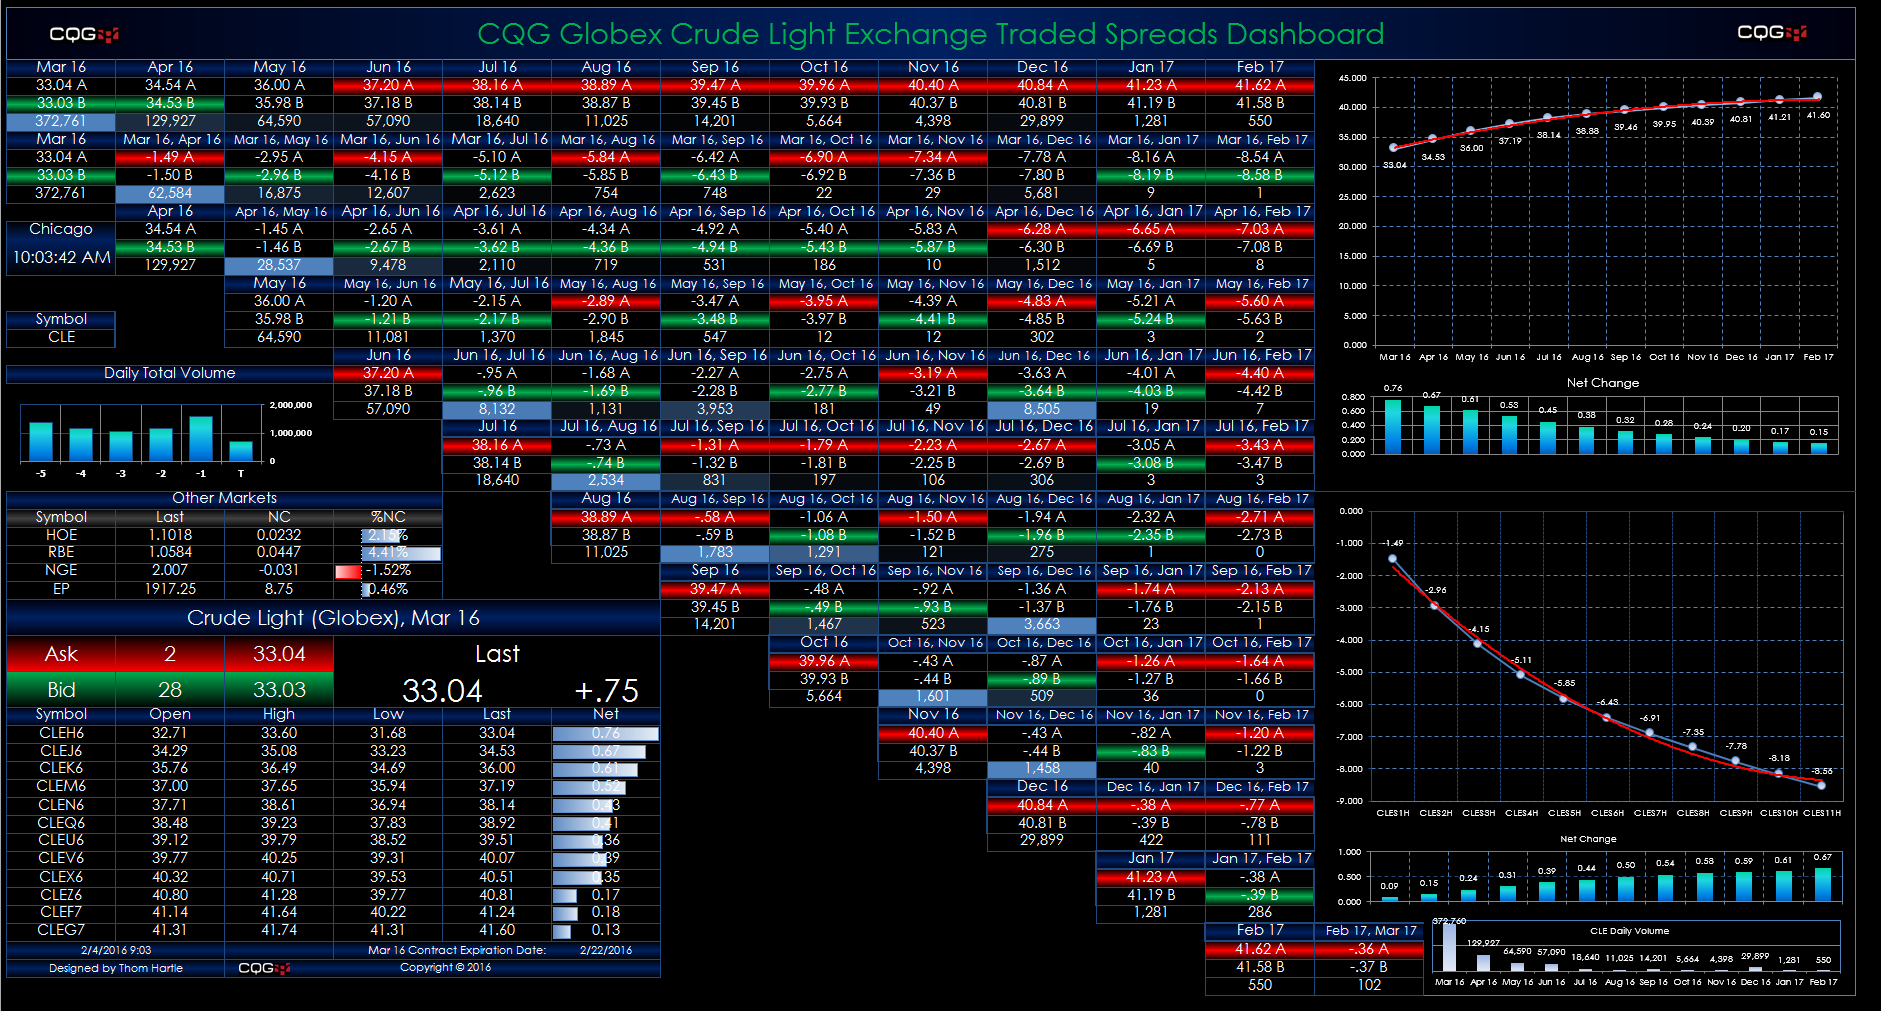
This Microsoft Excel® dashboard displays market data for crude oil spreads traded on the CME Globex platform. The dashboard is in a matrix-style format. The outrights are along the top row and the… more
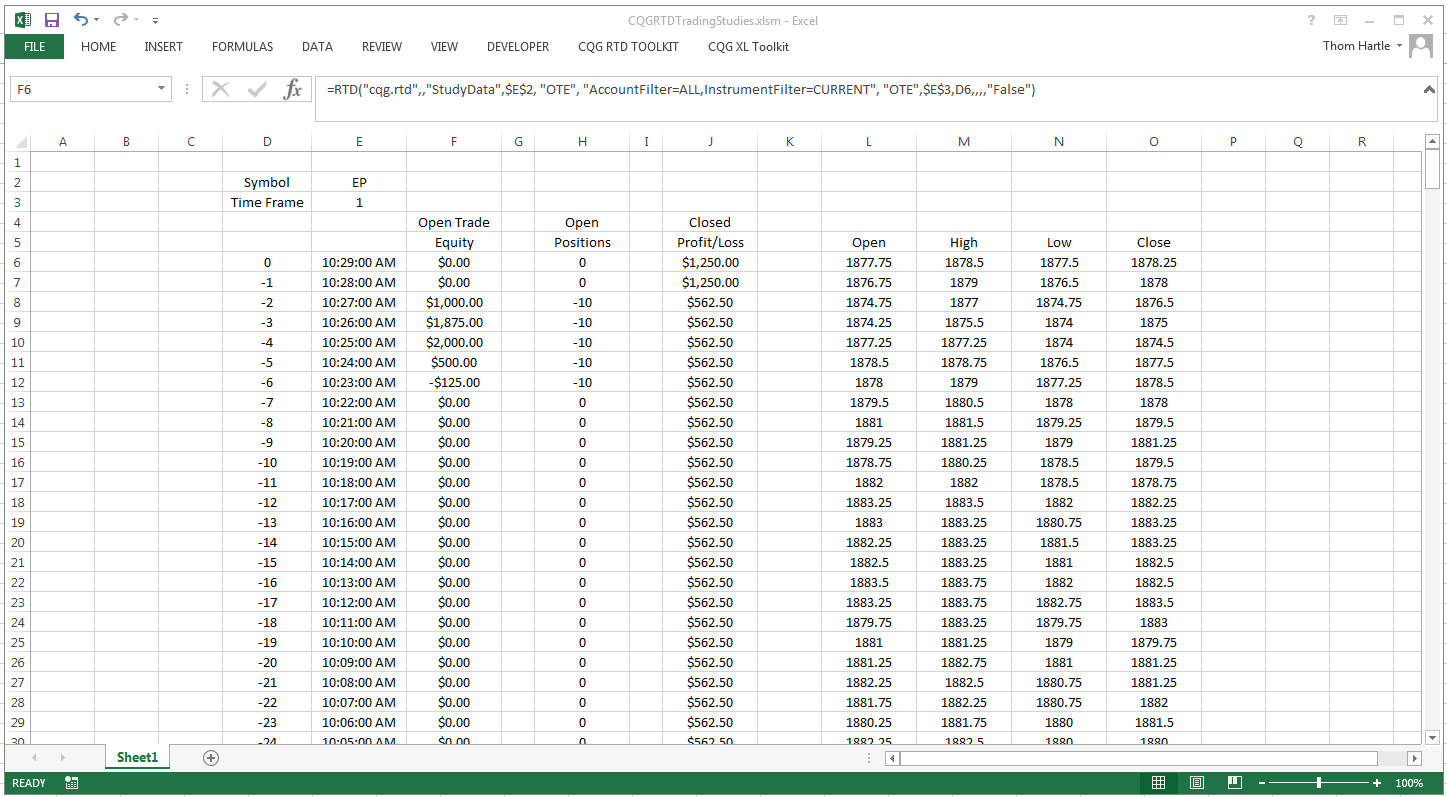
This Microsoft Excel® dashboard uses RTD formulas to pull the following CQG Trading Studies into Excel:
Open Trade Equity Position Profit & LossThese are study formulas and… more
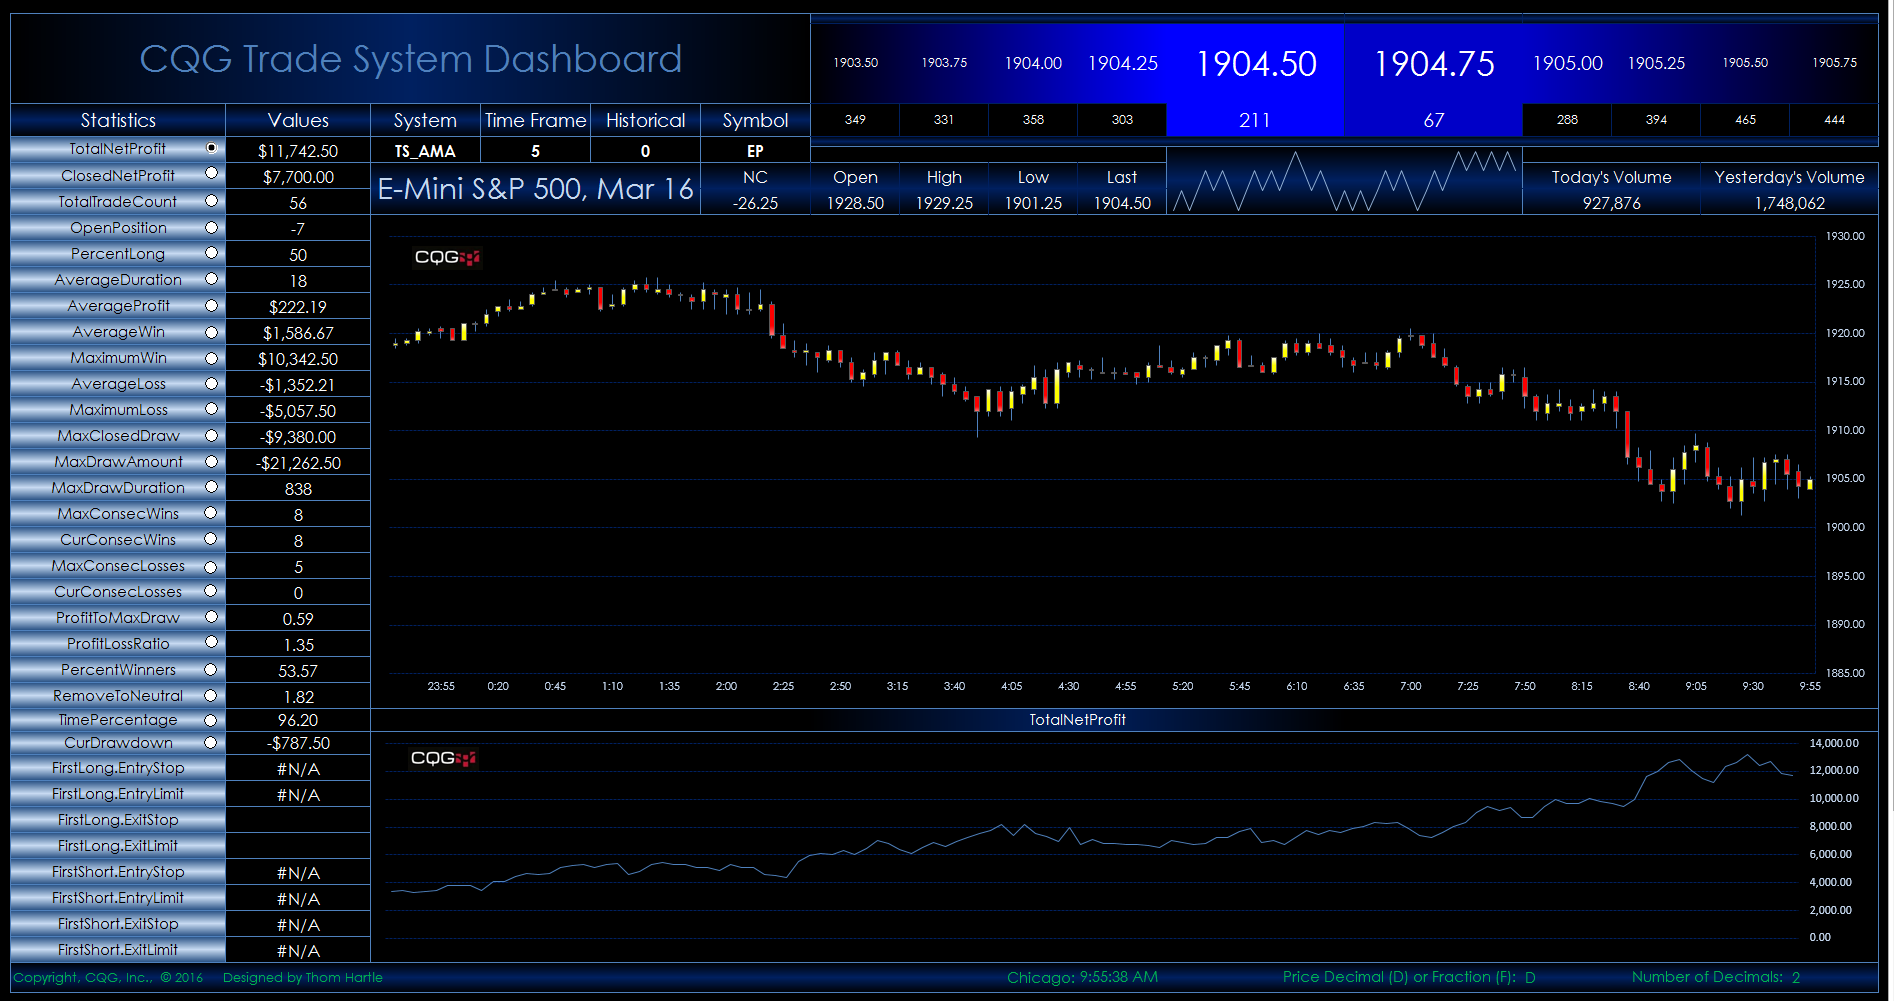
This Microsoft Excel® dashboard displays trade system statistics pulled from CQG’s Backtesting module. Enter the system's “short’ name, chart time frame, and symbol.
This new version… more
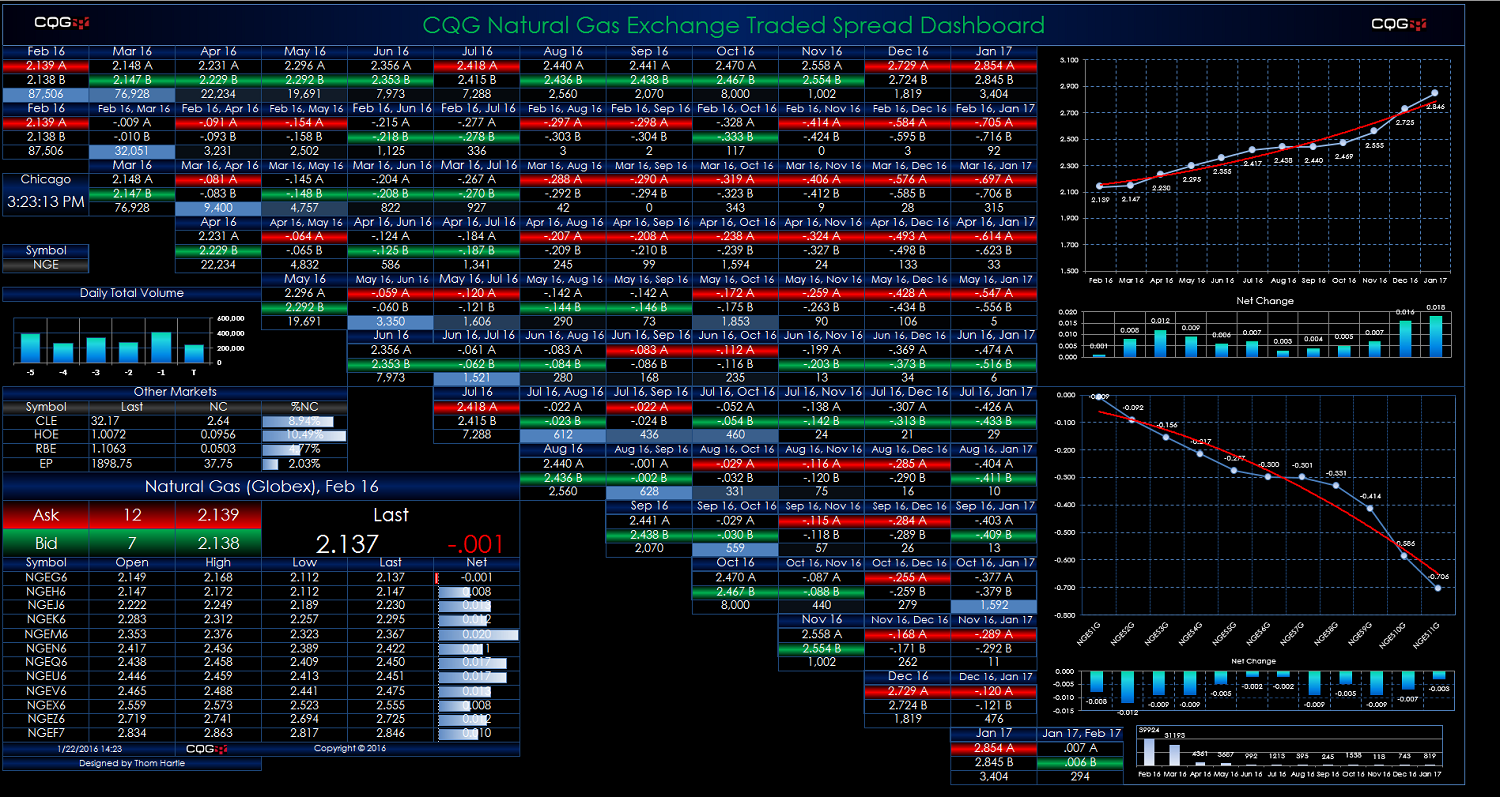
This Microsoft Excel® dashboard displays market data for natural gas spreads traded on the CME Globex platform. This monitor uses a matrix-style format. The outrights are along the top row and the… more

This Microsoft Excel® dashboard displays market data for Soybean Crush Spreads traded on the CME Globex platform. These spreads have an added layer of complexity due to the soybean contract not… more