
Watch this webinar to see professional futures trader John Netto, who is a longtime CQG customer, manage positions in real time across an array of asset classes, including currencies, metals,… more
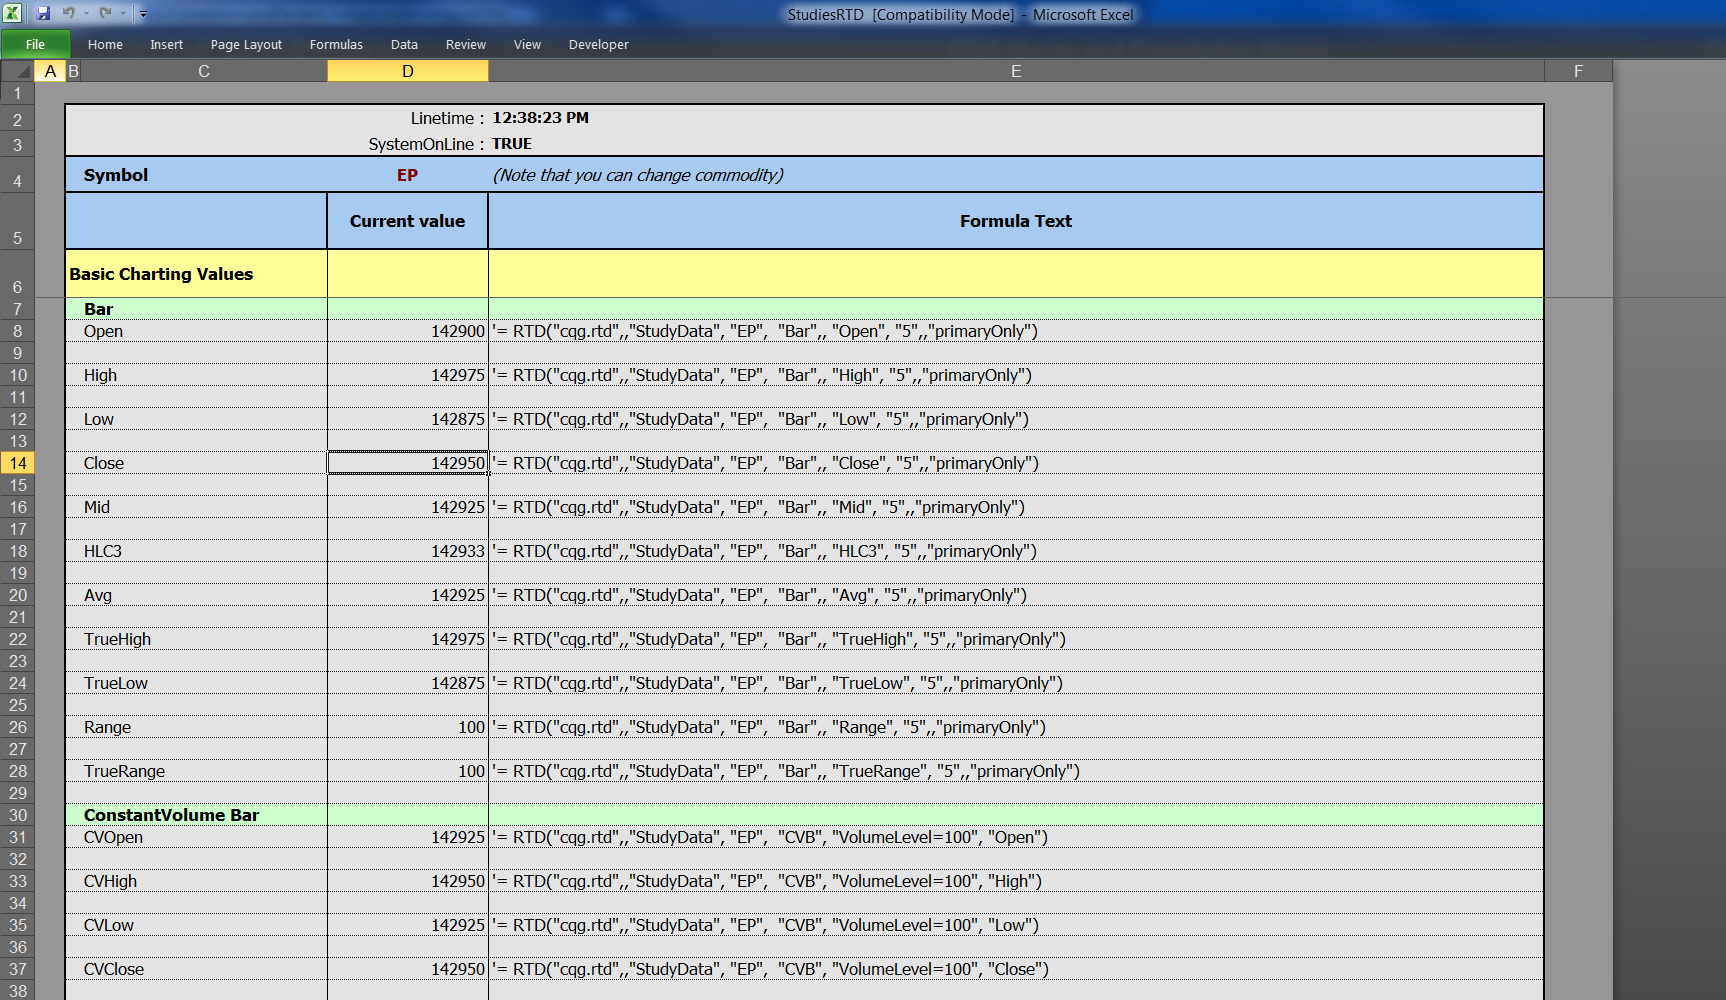
This spreadsheet provides a list of RTD formulas for historical bars and charting, requesting study data and study-related curves, calling a set of historical bars of all supported types, and… more

A Picture is Worth A Thousand Words
Join Andrew Egan Baptiste, CEO of T.A.G., the new and independent Technical Analysis Group, for a detailed webinar on reviewing and forecasting major macro… more
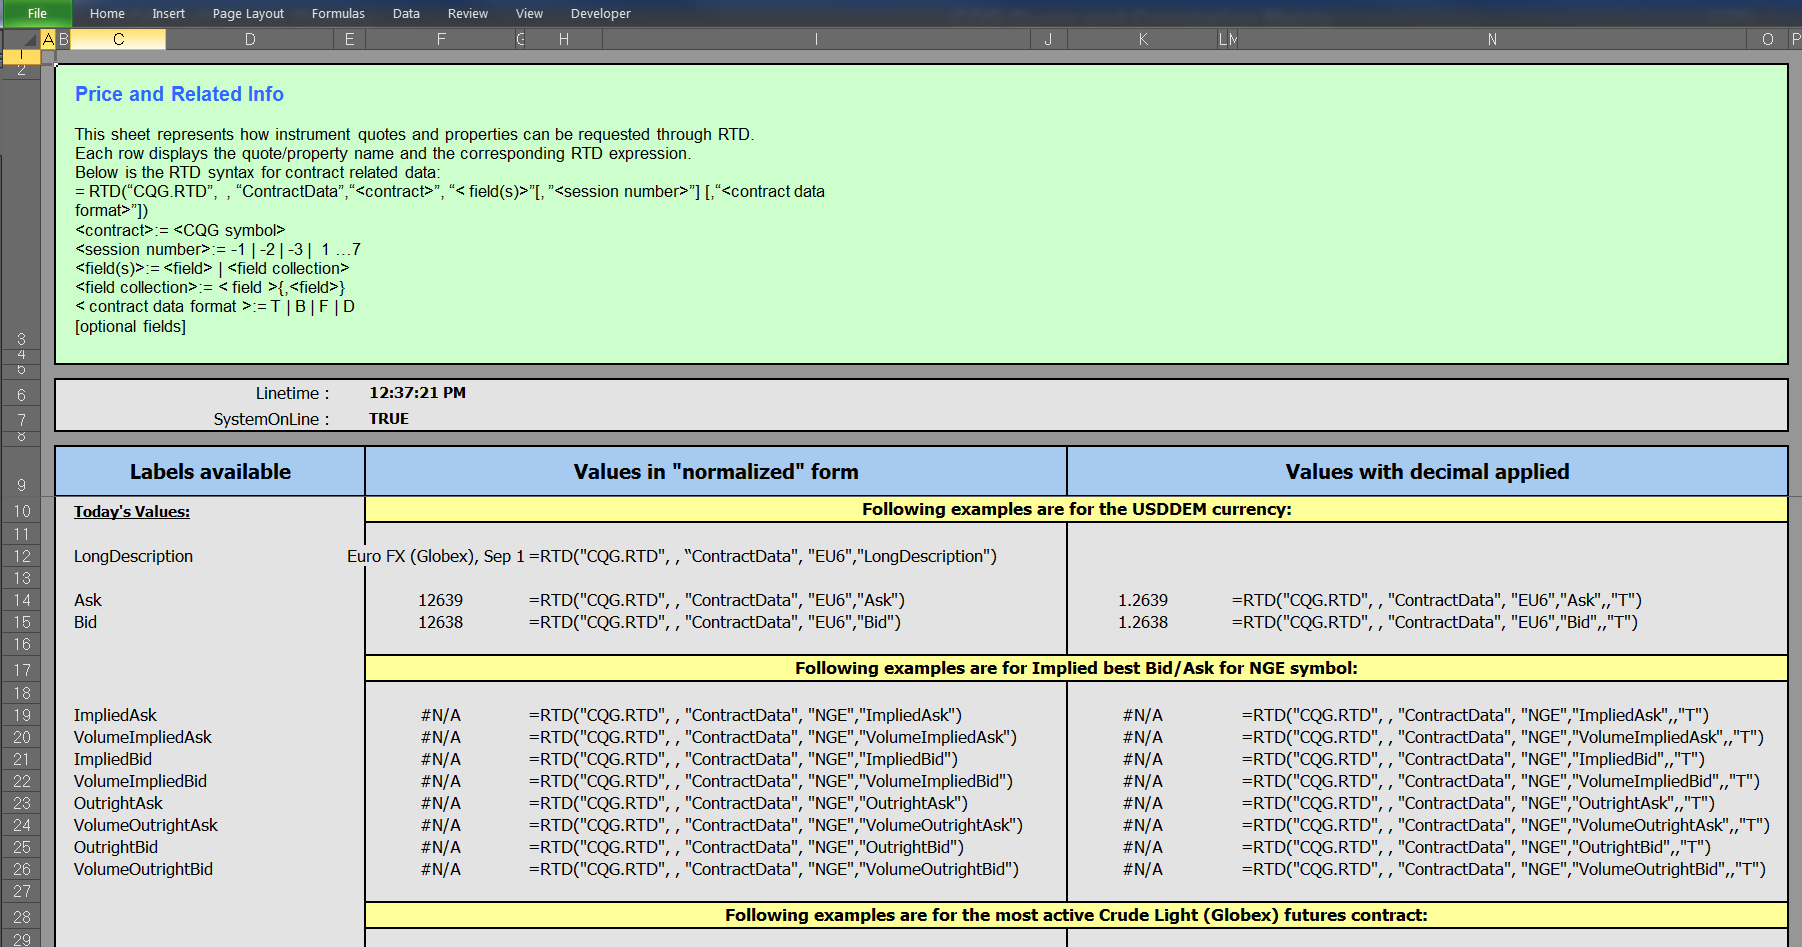
This spreadsheet provides a list of all available labels in market data in all types of contracts, including synthetic spreads. Orders and related statistics data include number of… more
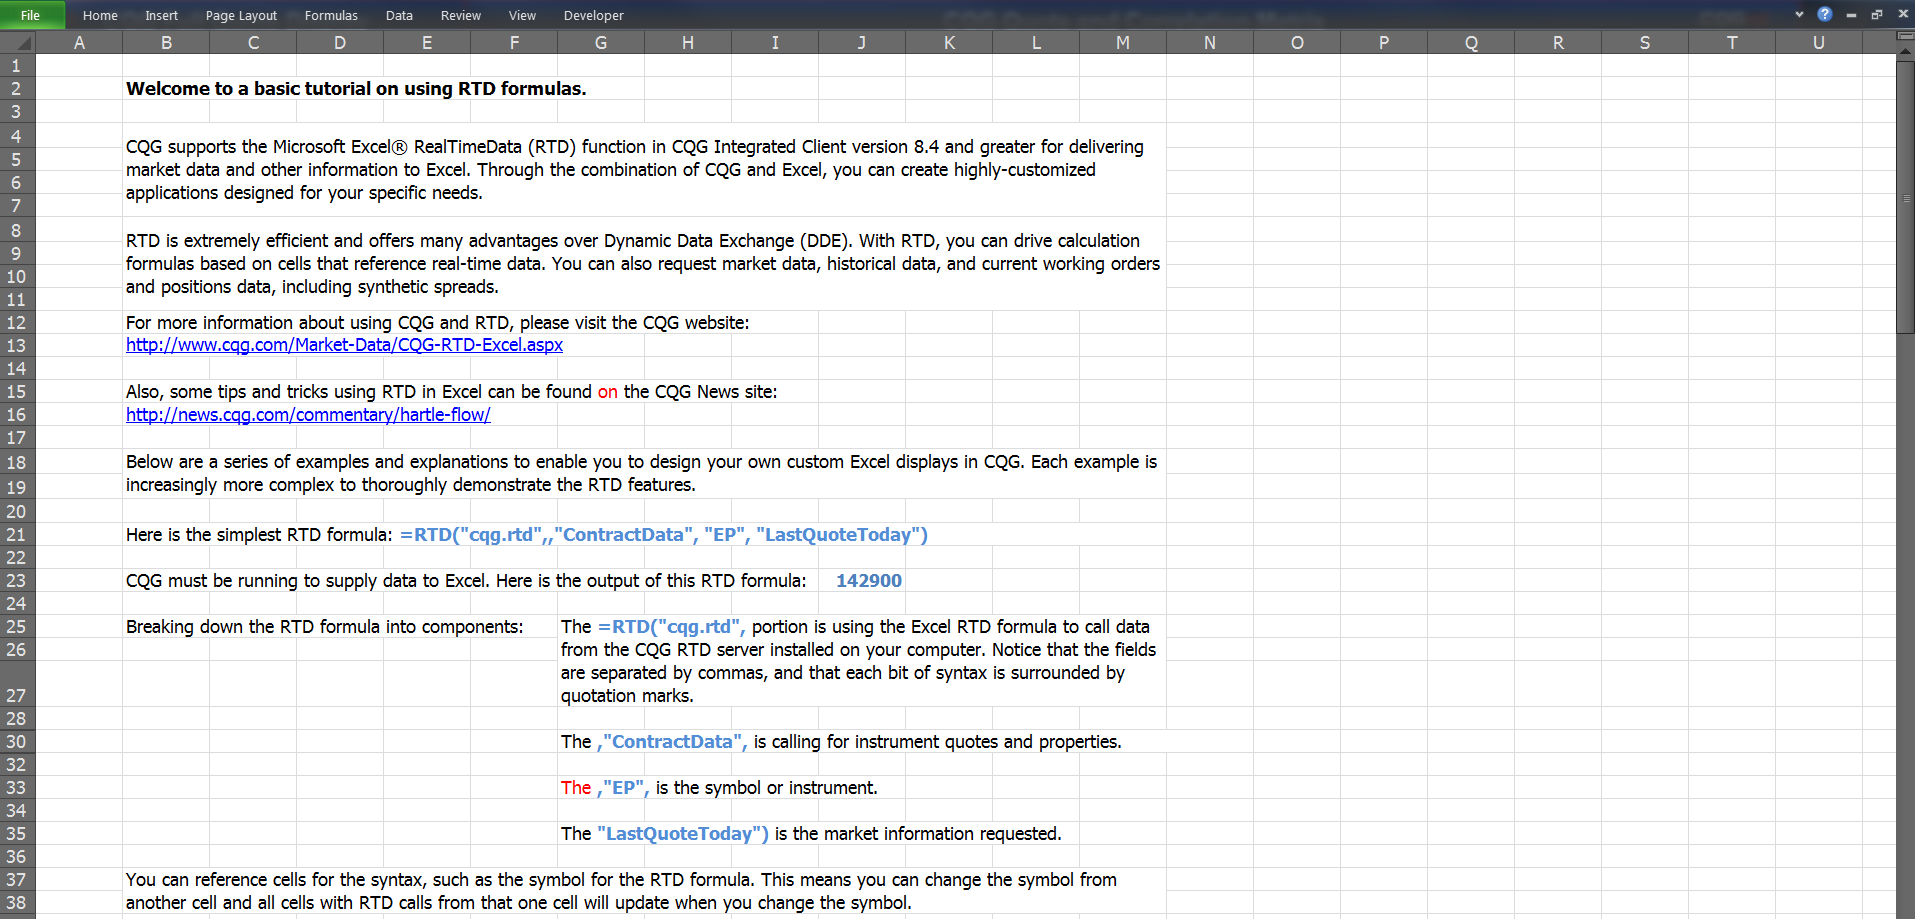
This spreadsheet outlines the basic syntax of RTD formulas and then details more complex formulas. Included is a collection of popular RTD formulas, which you can simply copy and paste into your… more
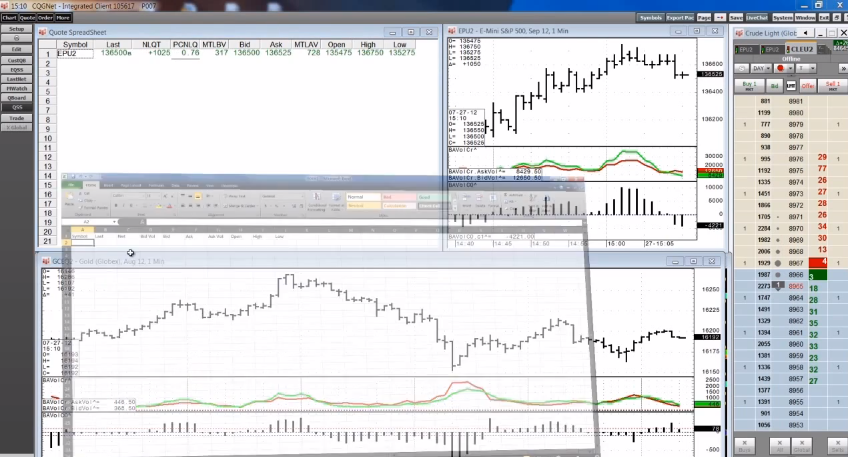
In this video, CQG Director of Product Training Thom Hartle walks you through the steps to easily build a Microsoft Excel® spreadsheet to display market data.
Our Trading in 2 video series features easy tips and tricks for trading in just two minutes. Tune in to Trading in 2 to learn how to enhance your own trading strategies.
In this video, CQG… more
This webinar is based on Richard Weissman's acclaimed book, Trade Like a Casino: Find Your Edge, Manage Risk, and Win Like the House.
Like casinos, successful speculators develop… more
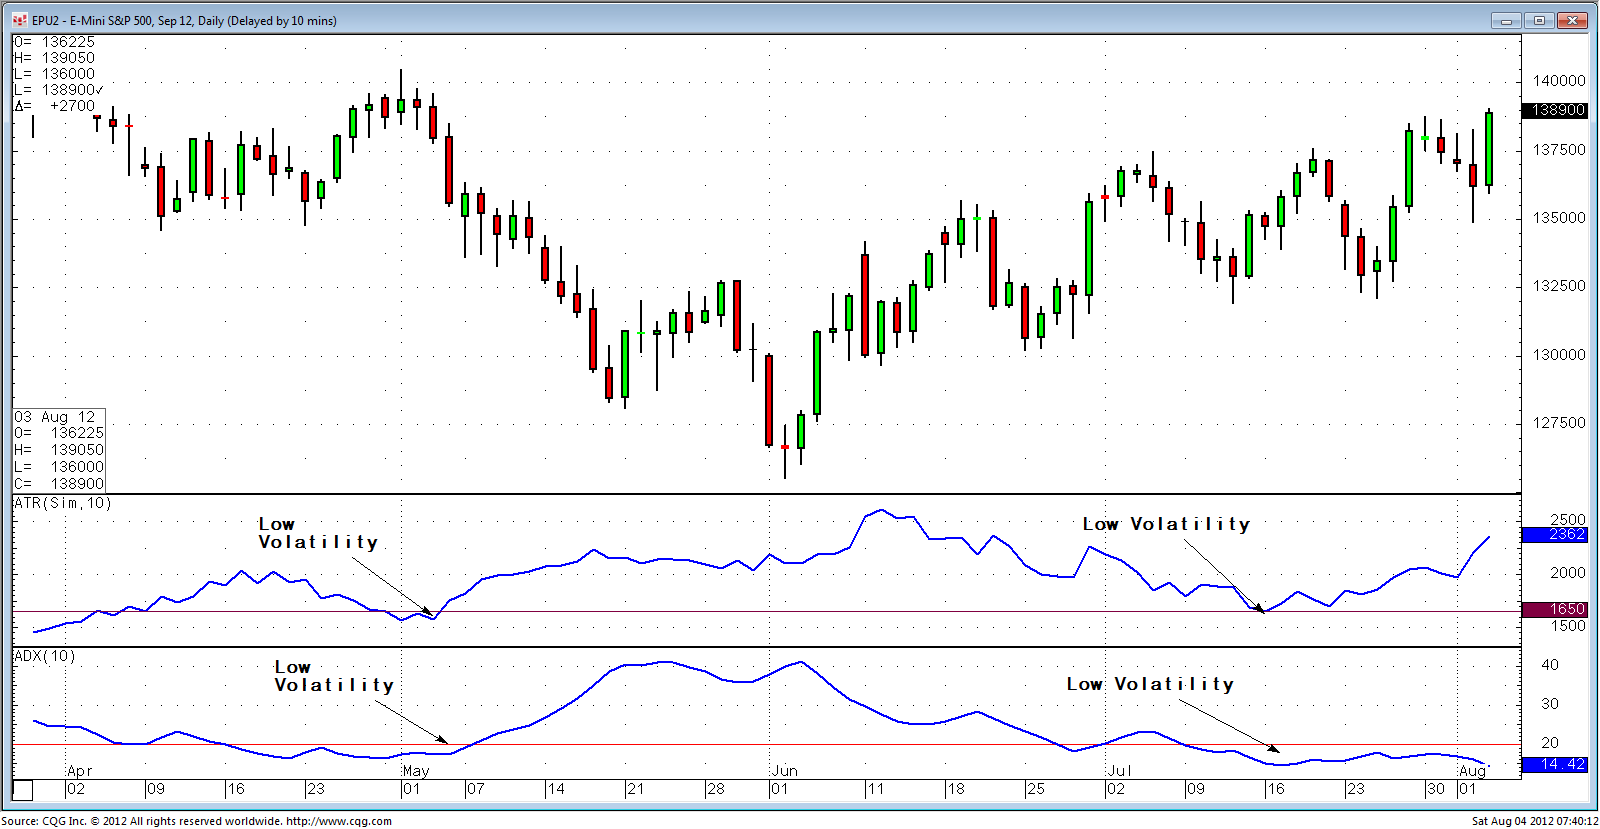
Although most mathematical technical indicators focus on capitalizing on either trending behavior by using tools like moving averages (see Trend Following Kept Simple: The 200-Day Simple… more
This webinar outlines the benefits of using Kase StatWare trading studies in CQG.
Learn how to use Cynthia Kase's "easy entry" color-coded buy/sell system and how to manage trade risk using… more