This midweek snapshot shows a mostly positive performance for the Equity Index futures markets. The best performer in the Japanese market is the Nikkei 225 (Osaka), Jun 24 contract with a +… more
Each Wednesday this article will be updated with the current seasonal study using CQG's Seasonal analysis applied to the Soybean, Wheat and Corn markets. You can download the CQG pac providing the… more
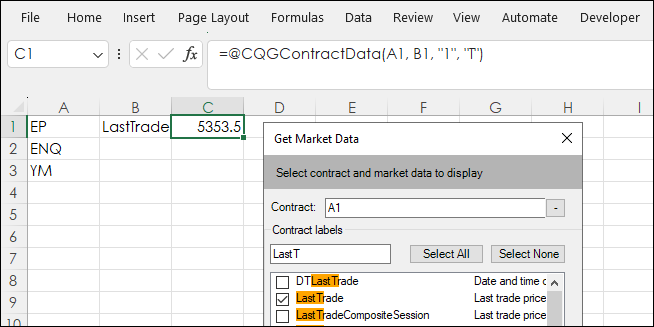
The RTD function displayed in the title of the post includes the "@" sign. If you use the CQG RTD Toolkit installed on the Excel Ribbon when either CQG IC or QTrader are installed to pull in "… more
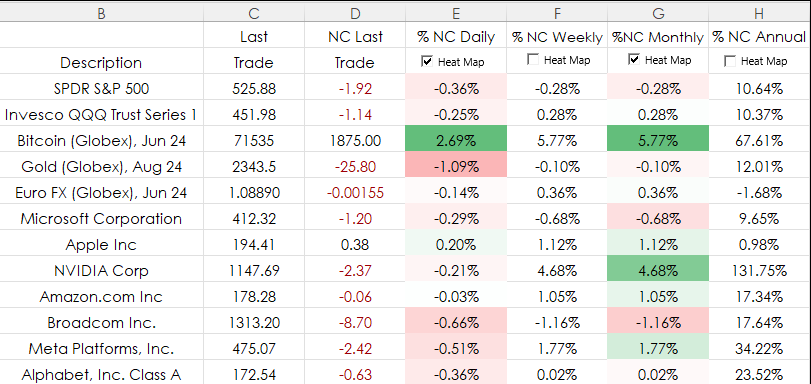
Heat mapping is a data visualization technique that highlights market performance using colors. Typically, bright green for the top performers and bright red for the weakest performers and… more
This midweek snapshot shows a predominantly positive performance for the Equity Index futures markets. The best performer in the Japanese market is the Nikkei 225 (Osaka), Jun 24 contract… more
Most of the Fixed Income futures markets are higher so far this week. The TSE 10 Year JGB, Jun 24 contract is up +0.66%. The best performer in the USA market is the 30yr US Treasury Bonds (… more
Each Wednesday this article will be updated with the current seasonal study using CQG's Seasonal analysis applied to the Soybean, Wheat and Corn markets. You can download the CQG pac providing the… more
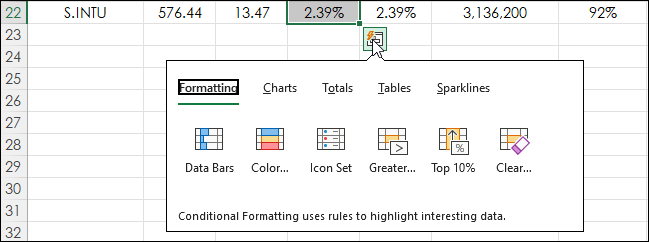
This post introduces using Excel's Quick Analysis Tool. First, a walkthrough of a typical application of one of Excel's data visualization features (heatmapping). In the image below heatmapping… more
Sign up to receive a list of the most recent posts to Workspaces. Learn about new features in IC and QTrader, how to work with Excel and RTD formulas, downloadable sample Excel spreadsheets, and… more
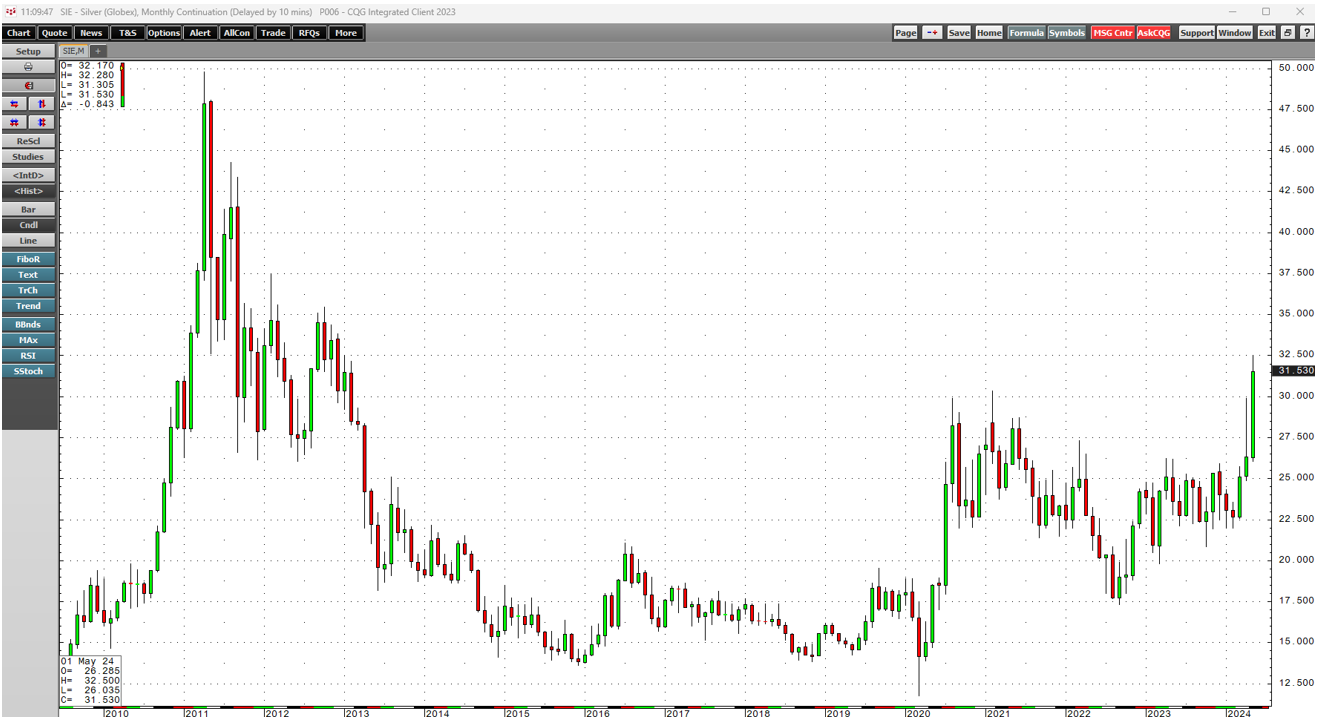
The silver bulls had reason to cheer in May as the second-leading precious metal and highly speculative silver futures market reached a significant milestone.
Technical resistance for the… more
