As a devoted CQG trader, investor, portfolio manager, hedger, etc., how does high frequency trading (HFT) affect the way you do business? Some might say that you can't get a good fill at your… more
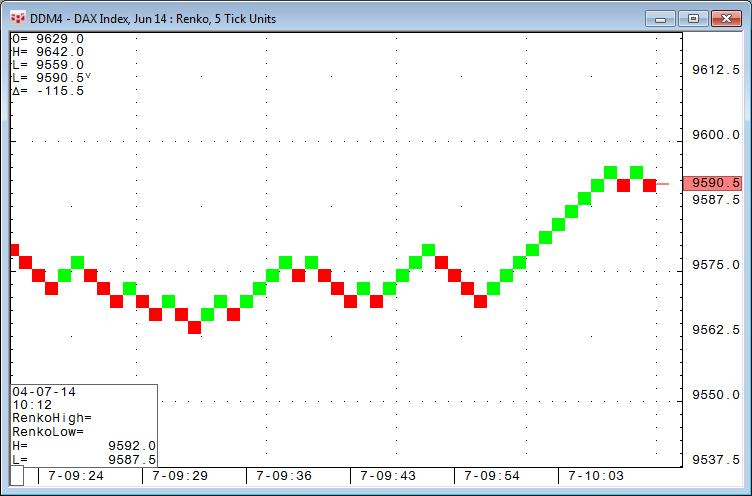
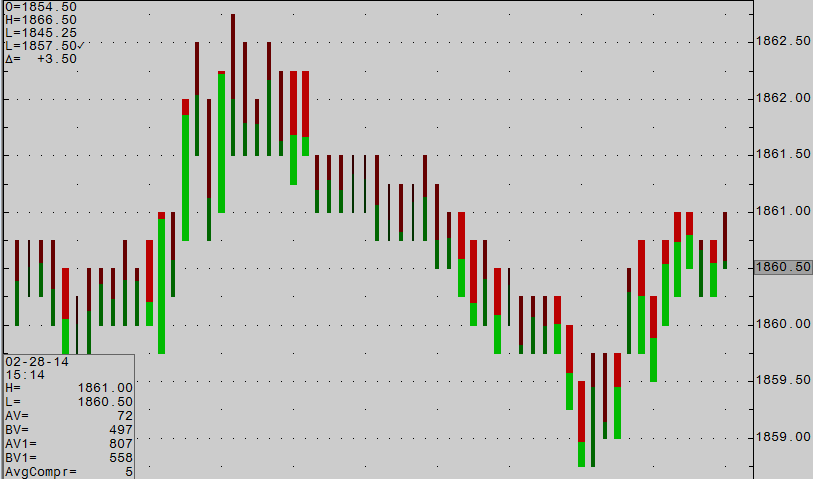
In CQG Integrated Client version of the year, CQG 2014, we have introduced four new chart types: Heikin-Ashi, sub-minute bar, range bar, and Renko. In this article, we will look at… more
This press release announced CQG's partnership with DirectFX and First Derivatives as well as the CQG FX trading platform. By opening access to DirectFX via First Derivatives' Delta Flow… more
CQG Provided Technical Analysis and Order Execution Software for University Teams
Denver, CO, March 21, 2014 - As a proud sponsor of the CME Group Trading Challenge, CQG provided the… more
This webinar demonstrates Bell Curve Trading's unique and powerful supply and demand trading methodology using CQG Integrated Client.
Joseph Musolino creates trading strategies with a… more
This Microsoft Excel dashboard is used to track the performance of a collection of Exchange-Traded Funds (ETFs).
The market information displayed is the last price, net change, the… more
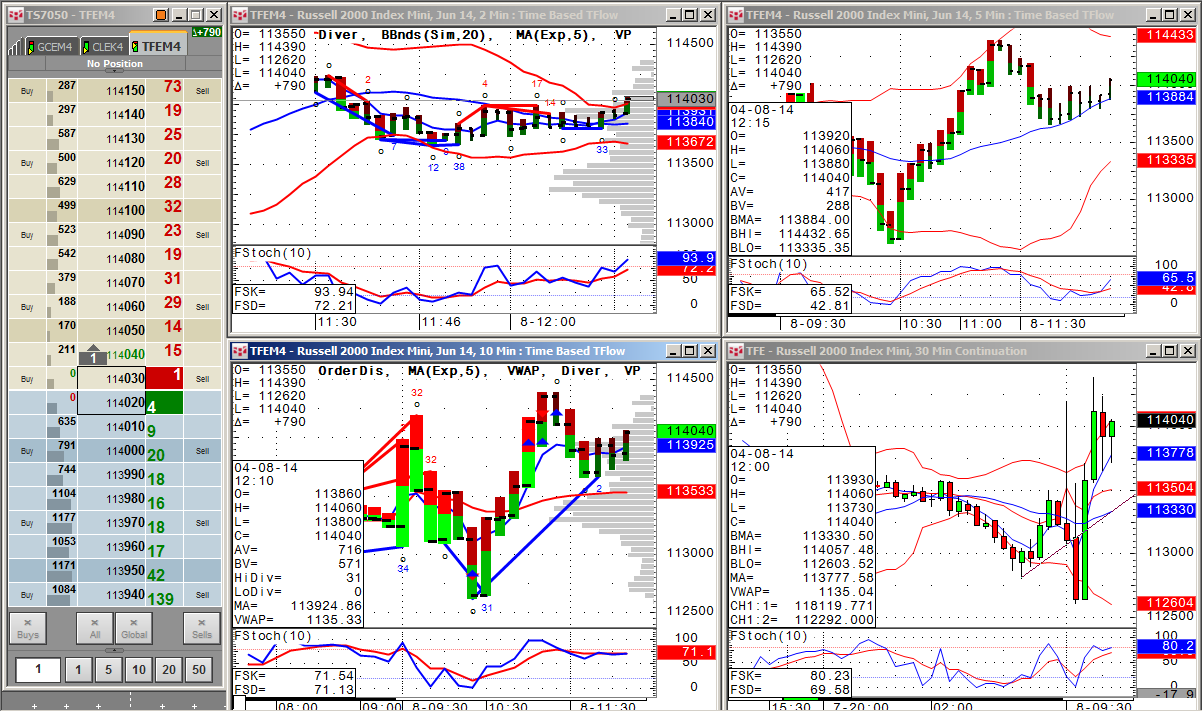
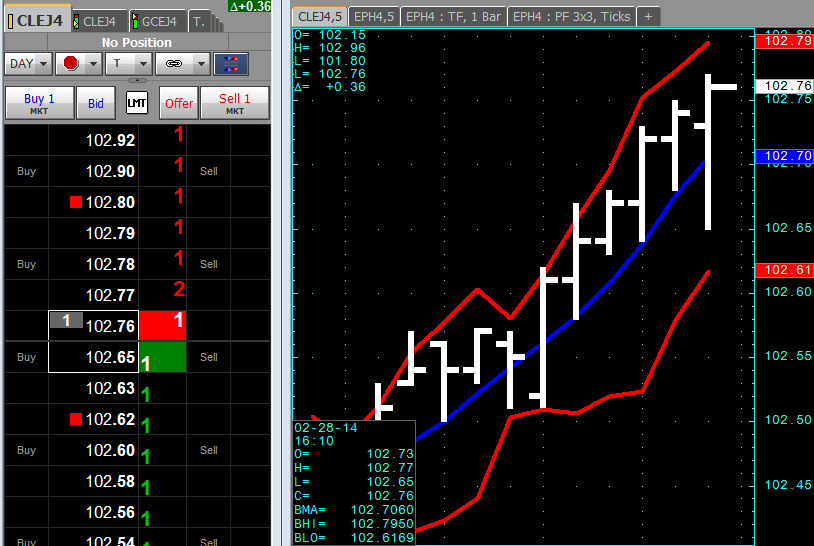
Watch this video to learn how to use CQG's Study-Following Orders. You can set the DOMTrader to display the same values of a study on the price ladder, such as Bollinger Bands from the chart, and… more
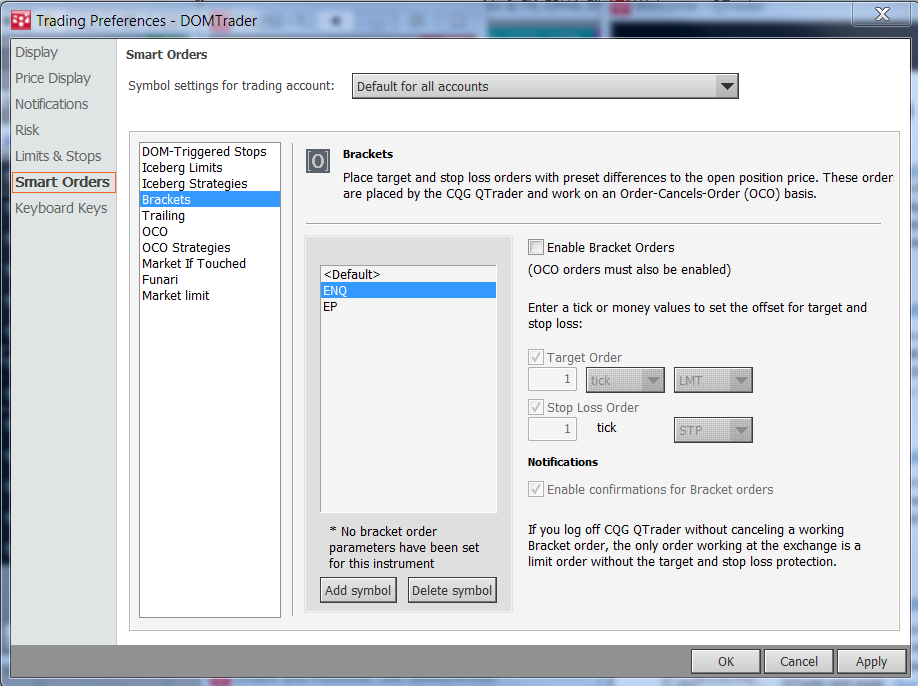
Watch this video to learn how to use CQG Smart Orders in CQG QTrader. Smart Orders include OCO, bracket, DOM-triggered stops, and more.
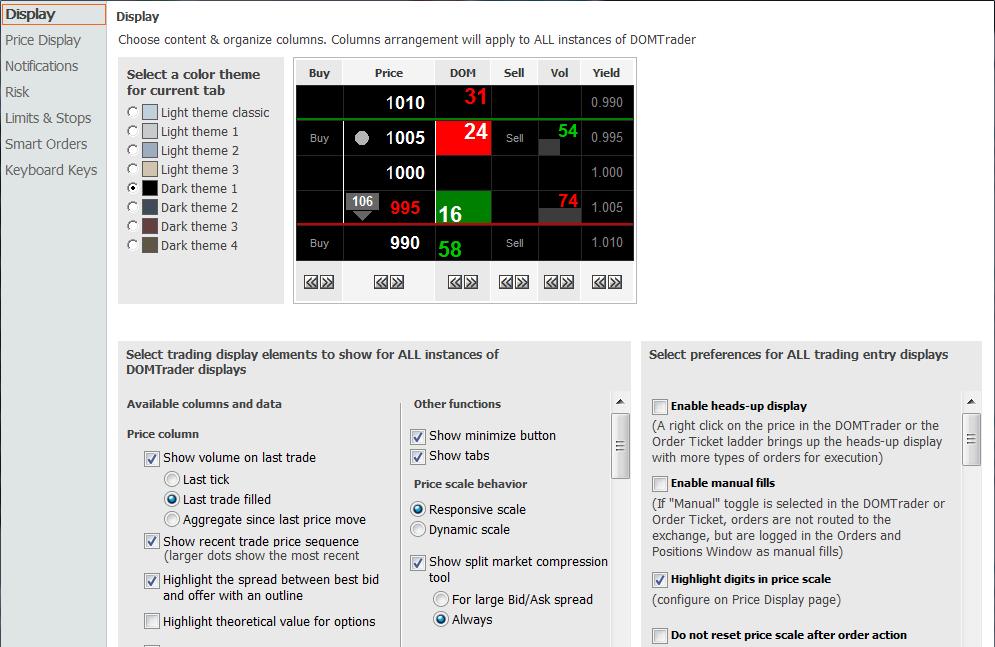
Watch this video to learn how to configure the DOMTrader® in CQG QTrader, including changing themes, setting up notifications, and using keyboard trading.
