In CQG Integrated Client version of the year, CQG 2014, we have introduced four new chart types: Heikin-Ashi, sub-minute bar, range bar, and Renko. In this article, we will look at Renko charts.
A Renko chart is a non-time-based chart constructed of bricks that indicate price movement as a way to help expose trends and support and resistance levels. A brick is created each time the price exceeds the top or bottom of the previous brick by some amount, which you set in preferences.
Calculation rules:
- Except for the first and last bars of a session, a Renko brick must have a high-to-low range that equals the specified range.
- Except for the first and last bars of a session, the current Renko brick low must touch the previous brick high, or the current brick high must touch the previous brick low.
- Except for the first and last bars of a session, a new Renko brick must be started at the session open.
- A new Renko brick is drawn only when it is completed.
Renko charts have no gaps, meaning that if price changes by a multiple of a specified tick/price increment, the number of bricks that will be drawn on the chart will be proportional to total price move divided by a specified tick/price increment. In CQG we refer to such bricks as null bricks.
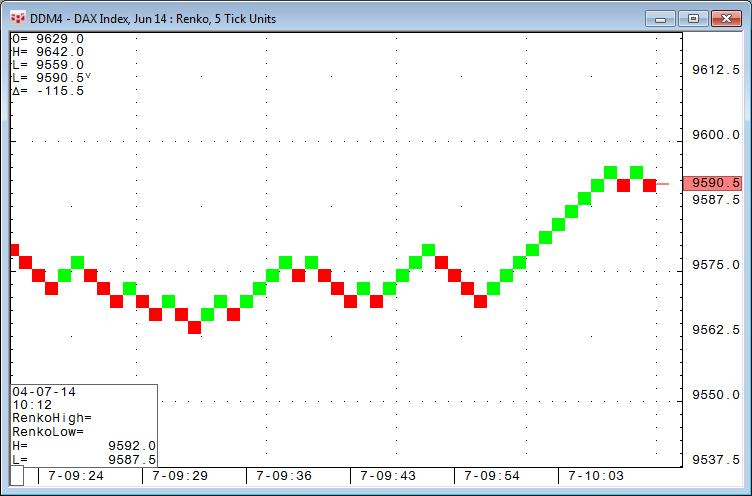
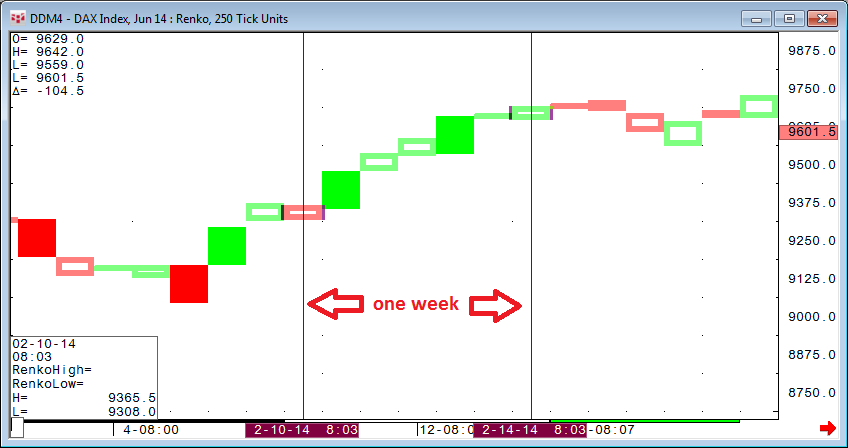
Technically it is possible to run all kinds of studies and trading systems on a Renko chart, but there is one limit that will become quite obvious when you try to start looking into historical results. A maximum of 4096 Renko bars can be built. Depending on the tick size selected, that might be only a couple of days' worth of data. For example, a five-tick DAX (DDM4) Renko chart would display approximately ten days of history where setting the Renko chart to use 250 ticks the chart would display nearly six-months of history. One day might have only one to three Renko bricks.
For more detailed information about Renko charts, please refer to our online manual.
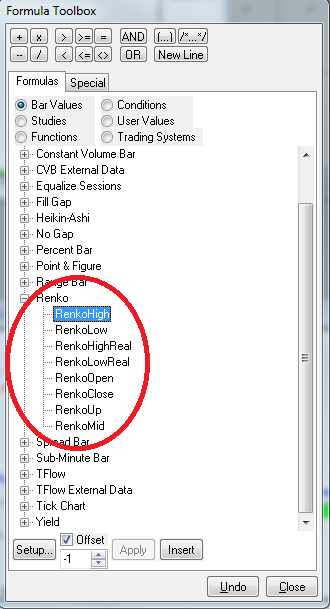
Renko charts are fully featured in CQG's formula toolbox:
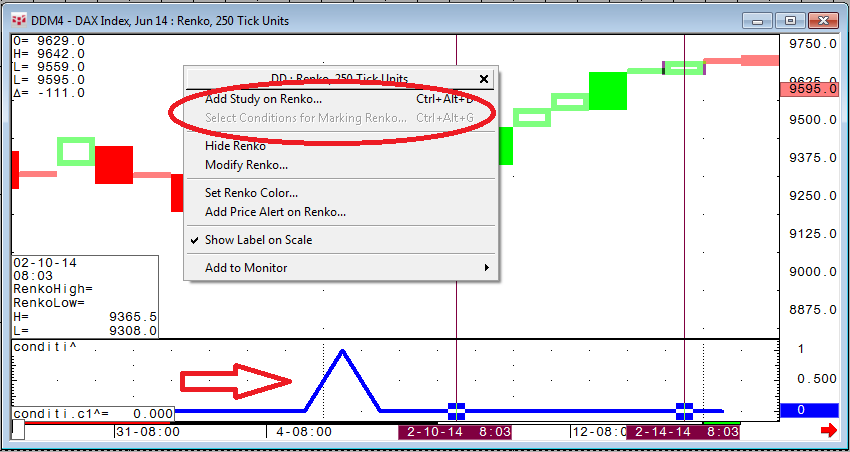
Renko charts do not allow the application of conditions for marking bars. A simple workaround for this is to apply your code to a custom study and display it underneath the chart. The study will result in "1" for true and "0" for false.