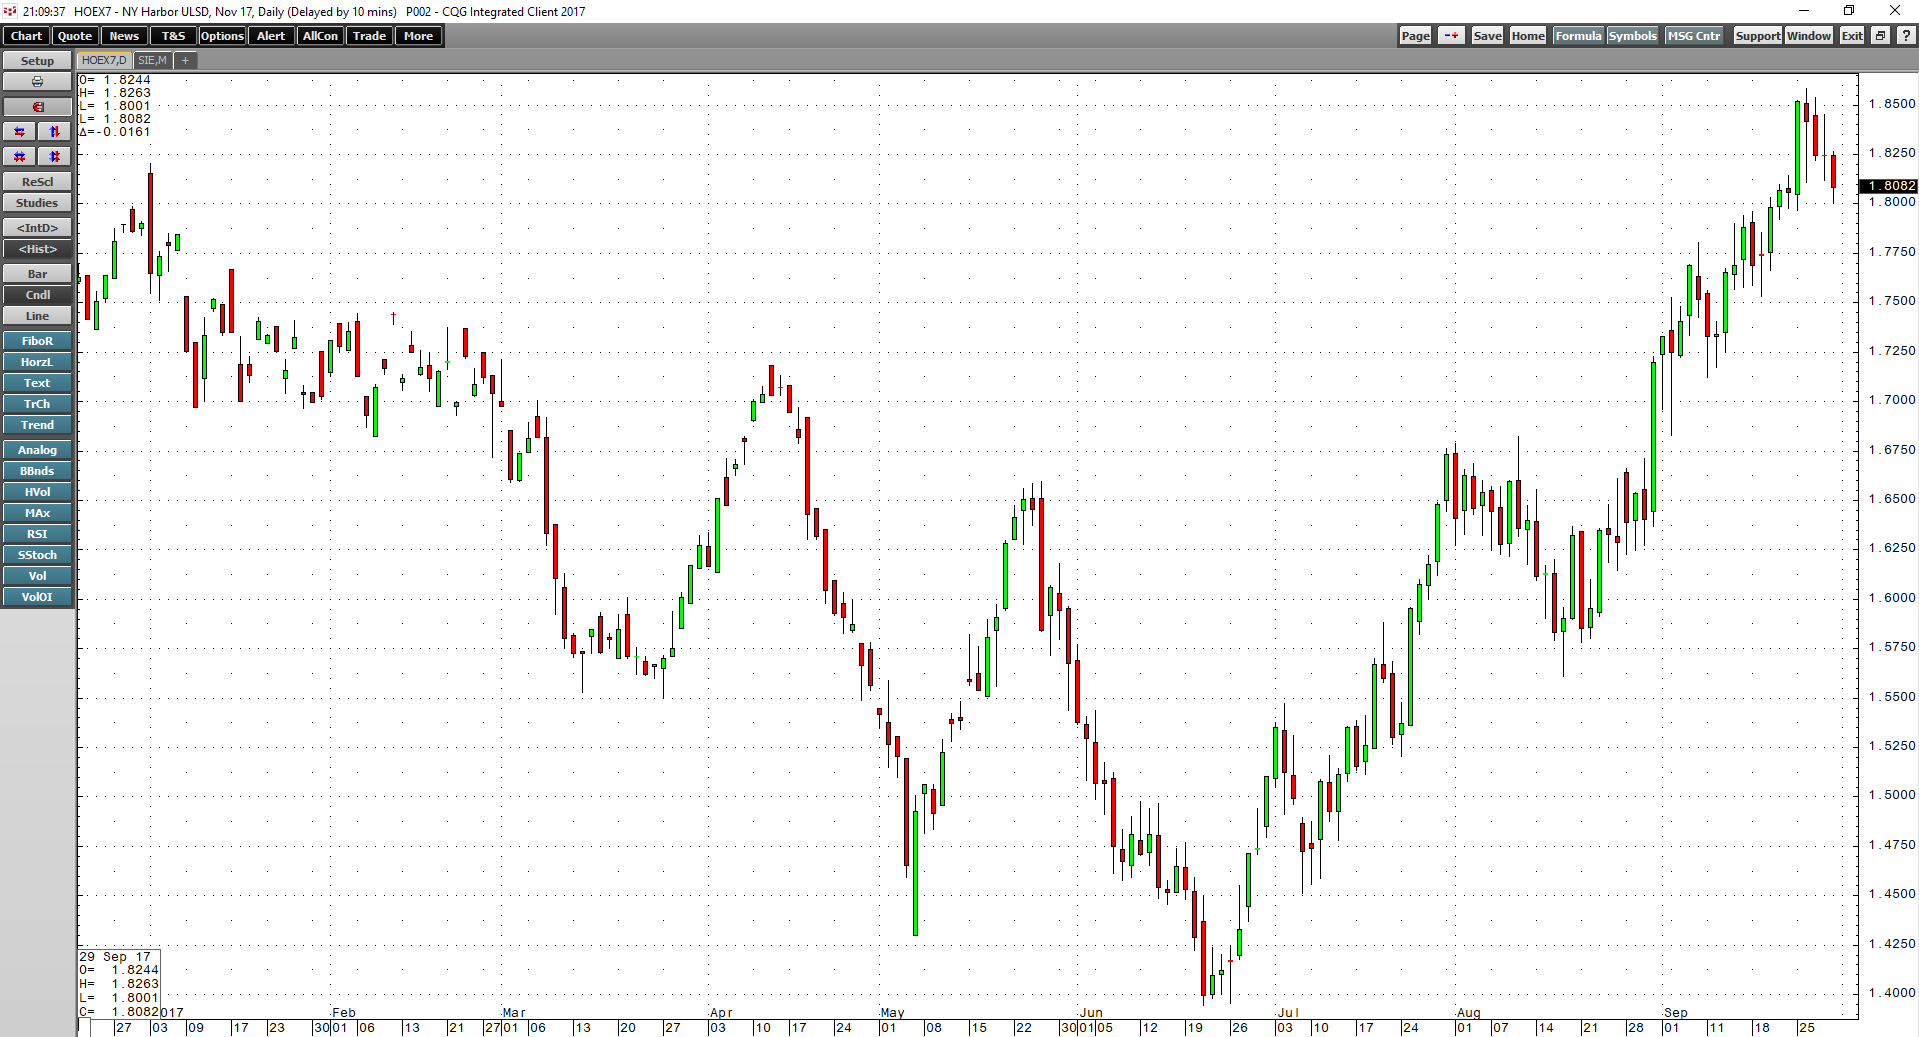
The dollar index moved lower by 2.66% in the third quarter of 2017, and commodities prices moved higher with four of the six major sectors posting gains. Out of the 29 commodities that I follow,… more
CQG Releases New Features
CHICAGO / DENVER, Sept. 27, 2017 – CQG, a leading global provider of high-performance trade routing, market data, and technical analysis tools, announced today a… more
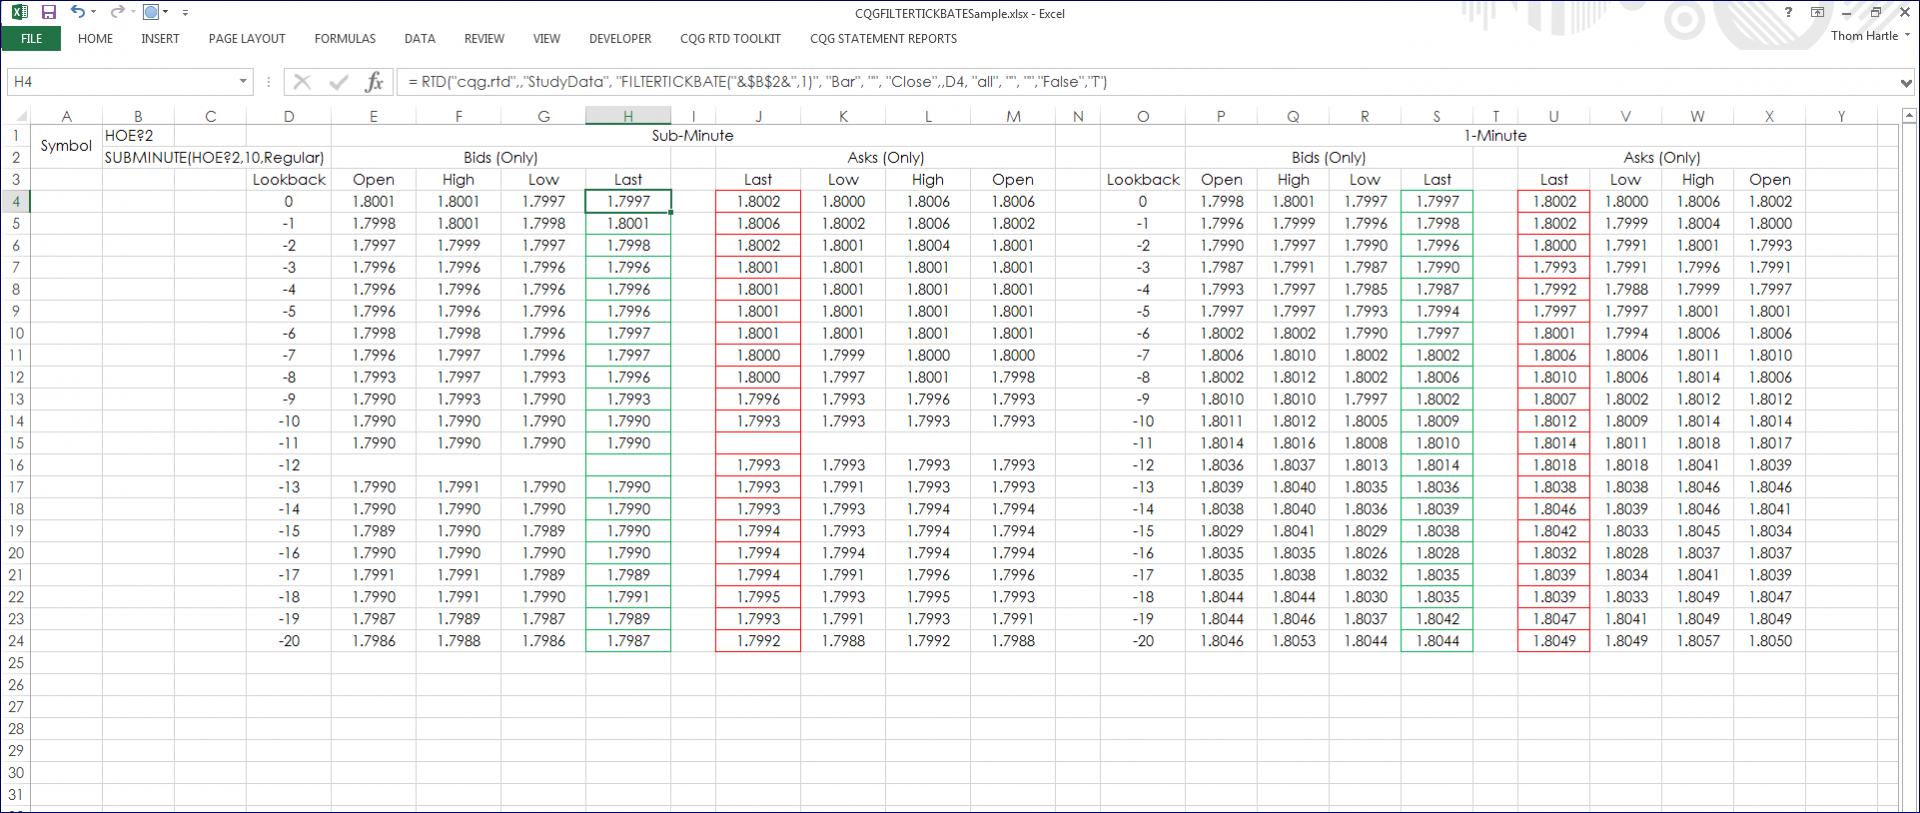
CQG charts have a setting called the BATS Charts Preferences. Here, you select what data to use to build the chart. You can use the default setting where the chart is built using trade and… more
These two Microsoft Excel® spreadsheets present Globex crude oil market data and forward curves, both current and historical. Two dashboards are available: The first the data includes outrights… more
Visit CQG at the 33rd Annual FIA Futures & Options Expo in Chicago.
Stop by booth 326 to see the latest from CQG, including:
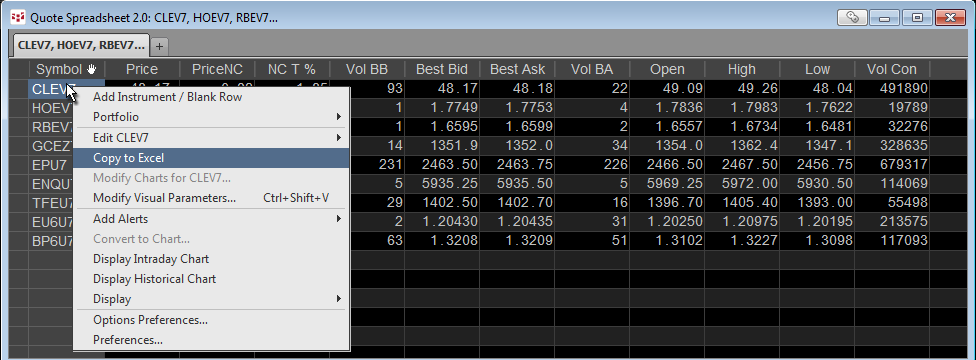
What's new in CQG… moreCustomers who use Microsoft Excel® when following the markets can easily populate their Excel spreadsheet with RTD formulas using CQG's Quote SpreadSheet (QSS) 2.0.
To open QSS 2.0, click… more
These two Microsoft Excel® dashboard display market quotes for tradable UDS for the crude oil contract and the E-mini S&P 500 traded on Globex. There is also a quote display with at-… more
Watch this webinar recording to see Jim Wyckoff examine the technical aspect of short-term and long-term analytical charts for all major futures and forex markets, including support… more
CQG makes it easier to manage orders and positions for multiple accounts by customer account number or sales series. Use our Microsoft Excel® style filtering to search for an order number or… more
