The dollar index posted a small loss of 0.85% in the third quarter of 2016, but that did not help the composite of commodities during the three-month period. The principal raw materials that trade on US and UK futures exchanges fell by 1.89% in Q3. The dollar is now 3.4% lower in 2016 and commodities have moved 10.58% higher. Many raw materials made multiyear lows in late 2015 and early 2016 but have recovered since. Despite a small overall loss over the period from July through September, there were mixed results in the commodities sector.
Mixed Results
The small loss for the quarter was misleading. Three of the six sectors posted gains, while the other three were losers. Base metals traded on the London Metals Exchange led commodities with a 10.47% increase in Q3. Soft commodities appreciated by 6.86% and precious metals moved 6.17% higher for the quarter.
The ugliest sector was animal proteins that lost 23.25% over the three-month period followed by grains that fell 10.16% on the fourth straight year of a bumper crop in the US. Finally, energy moved just 1.44% to the downside in Q3.
Other notable commodities outside of the composite also displayed volatility over the period. While iron ore only dropped 0.23%, lumber rallied 10.69%, and the big winner was the Baltic Dry Shipping Index that posted a 32.58% gain. As you can see, the overall result for the commodities sector was not that exciting, but when you peel back the onion, there were some big moves in individual raw material markets.
The Winners
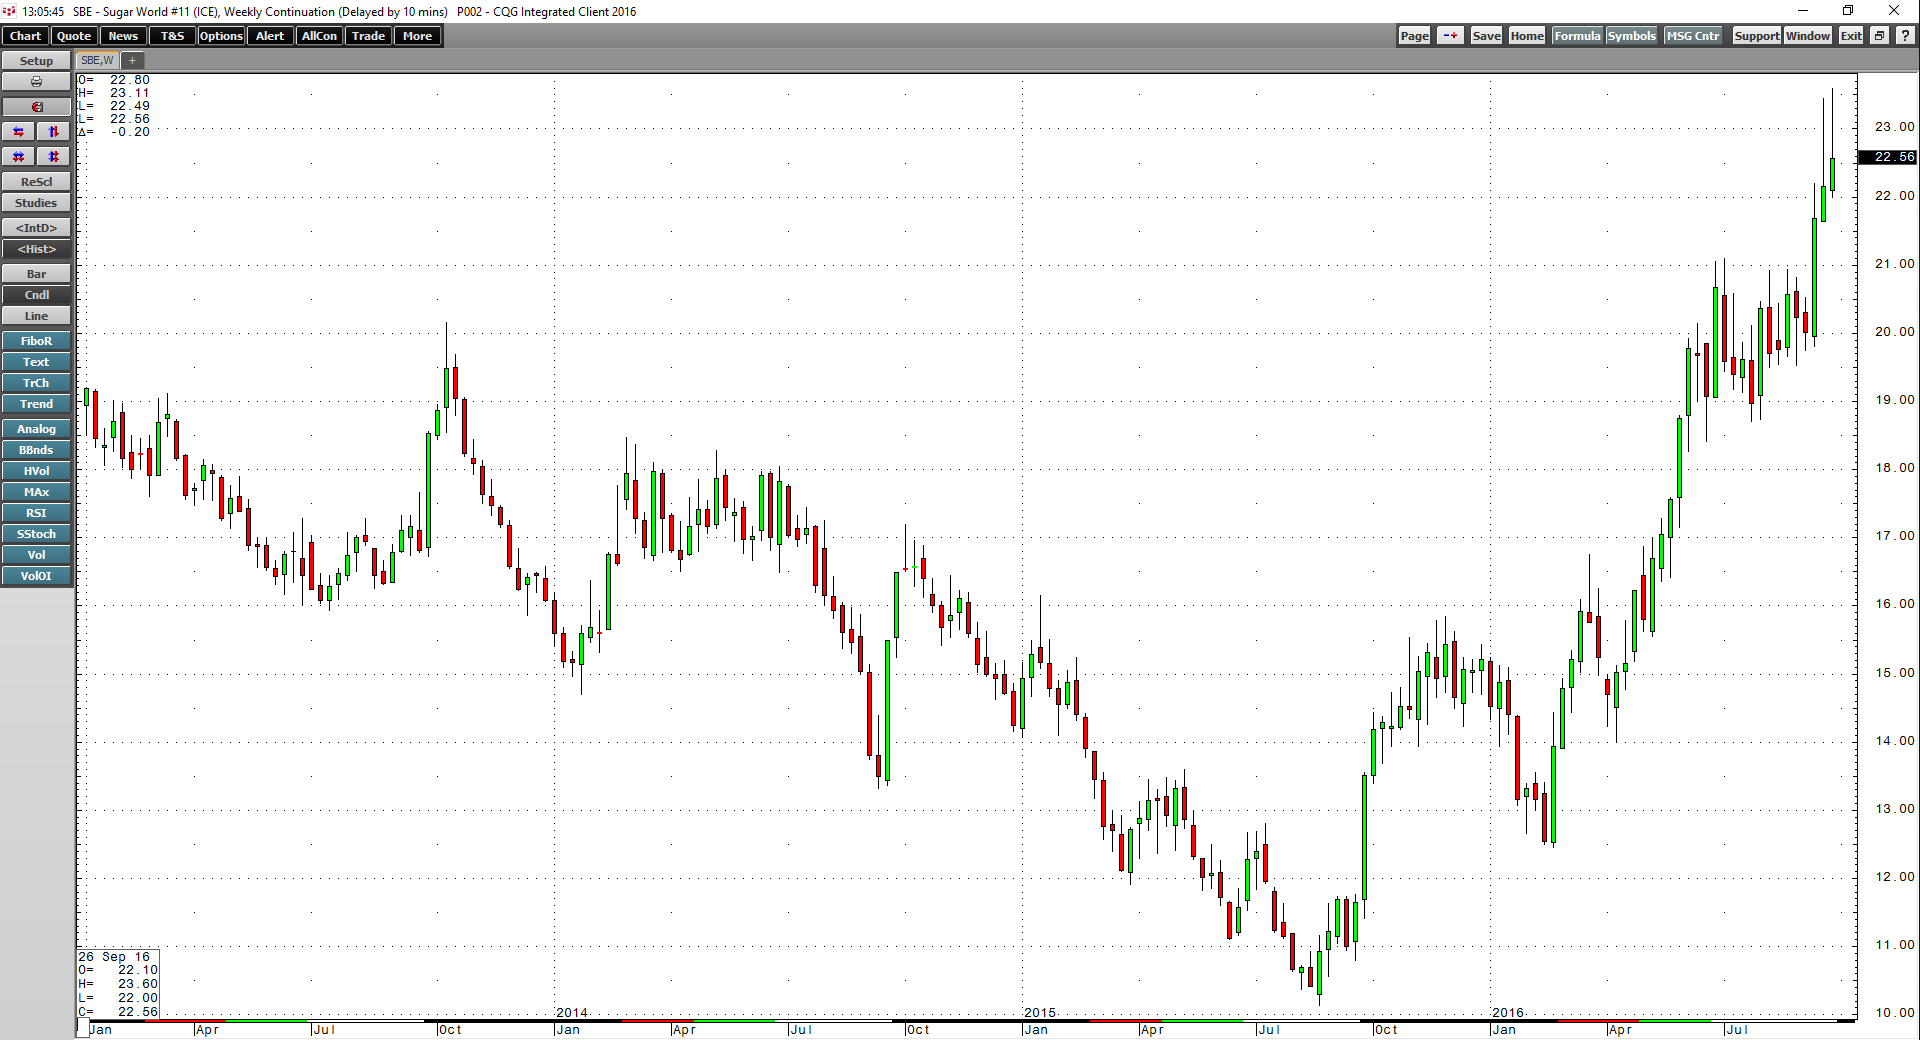
First place among the winners of the commodities that trade on futures markets went to palladium; the precious metal rallied by 20.78%. Palladium had lagged other precious metals in 2016 and played catch up. Lead and tin, two metals that trade on the LME, moved 18.06% and 17.99% higher respectively. Both metals have seen supplies shrink, leading to deficit conditions. Frozen concentrated orange juice futures rallied by 15.72% as citrus greening and weather issues caused a decline in supplies. Finally, fifth place went to sugar, which was up by 13.13% in Q3, adding to gains earlier in the year because of a fundamental deficit.
As the weekly chart illustrates, sugar is the overall leader in the commodity sector in 2016 with gains of 50.92% so far. The sweet commodity has more than doubled in price since the August 2015 lows at 10.13 cents per pound.
The Losers
Lean hog futures plunged by 41.13% during Q3 as the grilling season came to an end and oversupply conditions weighed on pork prices. After a spectacular rally earlier in the year, soybean meal fell by 26.5%, and soybeans shed 18.81% of value as the US bumper crop eased any supply concerns over the growing season. Feeder cattle and live cattle dropped 14.76% and 13.87% respectively over the past three months as oversupply pushed the price of live cattle below $1 per pound for the first time since 2010.
The weekly cattle chart shows that it has been the worst performing commodity of 2016. Finally, the bumper grain harvest caused oats to move 13.15% lower in Q3. On the year, the biggest losers were the cattle and hog markets.
While the commodities composite fell in Q3, the price action in one indicator tells us that the world’s largest consumer could be stepping up activity over recent months.
The BDI Says There is Action in China
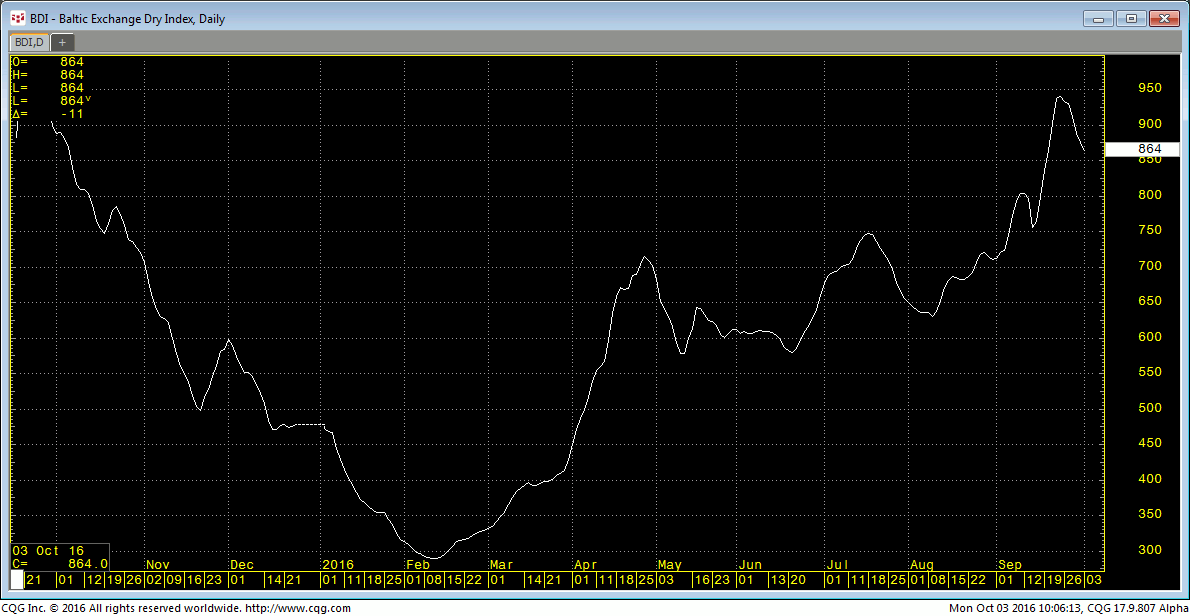
The Baltic Dry Index measures shipping activity for dry bulk cargos around the globe.
The BDI moved up by 32.57% in Q3 and is 84.21% higher so far in 2016. This index traded to all-time lows of 290 on February 11, 2016, and closed on September 30, 2016 at 875, an increase of over 200%. China is the world’s leading consumer of raw materials and the action in the BDI could be telling us that they are back in the market buying commodities. There are other signs that China is back in action. The double-digit rally in base metals is also a sign of Chinese demand.
Commodities fell in late 2015 and early 2016 as concerns about China’s economic slowdown weighed on markets. The price action in the BDI and base metals markets is likely because of increased demand from the Asian nation. Moreover, China continues to buy commodities that are under pressure. In Q3, China continued to import crude oil on price weakness to build their strategic petroleum reserve. In the weakest sector of the market, China bought the dip in Q3, making an investment in Wellard, the Australian cattle exporter, as the price of live cattle futures dropped to the lowest level in six years.
Volatility in Q4 - Three Significant Events
As we move into the final quarter of 2016, three major events could cause some wild market conditions over the coming months.
First and foremost, the US Presidential election on November 8 is a tight race according to the latest polls. The two candidates are highly polarizing figures with low popularity ratings. Markets are a reflection of the global economic and political landscape. The uncertainty of the election in the world’s leading economy is likely to translate to volatility across all asset classes over the first five weeks of Q4.
At the end of November, OPEC will meet in a formal session. At a meeting in Algeria at the end of Q3, the cartel and the Russians indicated that there is likely to be a production cap at the 32.5 million barrel per day level that needs ratification at the formal meeting.
Finally, on December 14, the US Federal Reserve will announce whether interest rates in the US will rise at all in 2016. After a promise to hike rates 3-4 times this year in December 2015, the central bank has yet to act.
All of these events are likely to establish the path of least resistance for commodity prices in Q4, but there is always the chance of another unforeseen event that will cause volatility in the world of raw materials.


