
This midweek look shows the Nikkei 225 (Osaka), Sep 26 contract, with a gain of +3.97%. The best performer in the US market is the E-mini NASDAQ 100, Sep 26 contract showing a gain of +1.67… more

Midweek, the OSE 10 Year JGB, Sep 26 contract is lower -0.42%. The best performer in the US market is the 2yr US Treasury Note (Globex), Sep 26 contract, which is lower by -0.2161%. The… more

Each Wednesday this article will be updated with the current seasonal study using CQG's Seasonal analysis applied to the Soybean, Wheat and Corn markets. You can download the CQG pac providing the… more
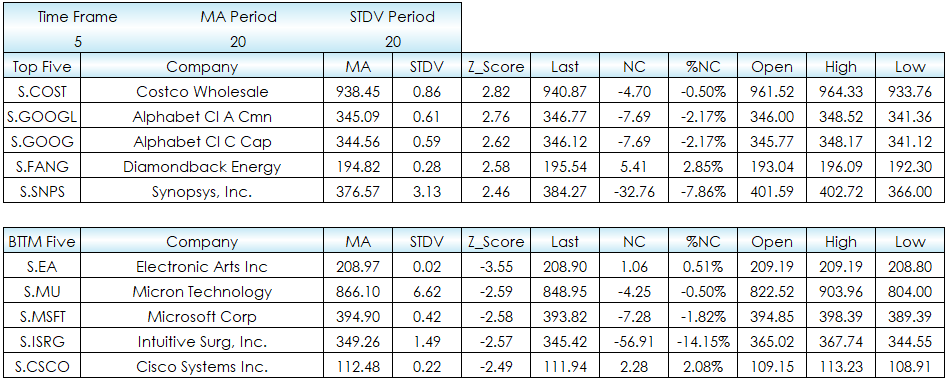
This post details an Excel dashboard for measuring the Z-Score of stocks from the NASDAQ 100. The dashboard sets the parameters as user defined inputs for the time frame, the average lookback… more
Various improvements and bug fixes.
We hope that these updates help improve your trading workflow. We continually strive to improve your CQG One and CQG Desktop experience. We invite you to… more
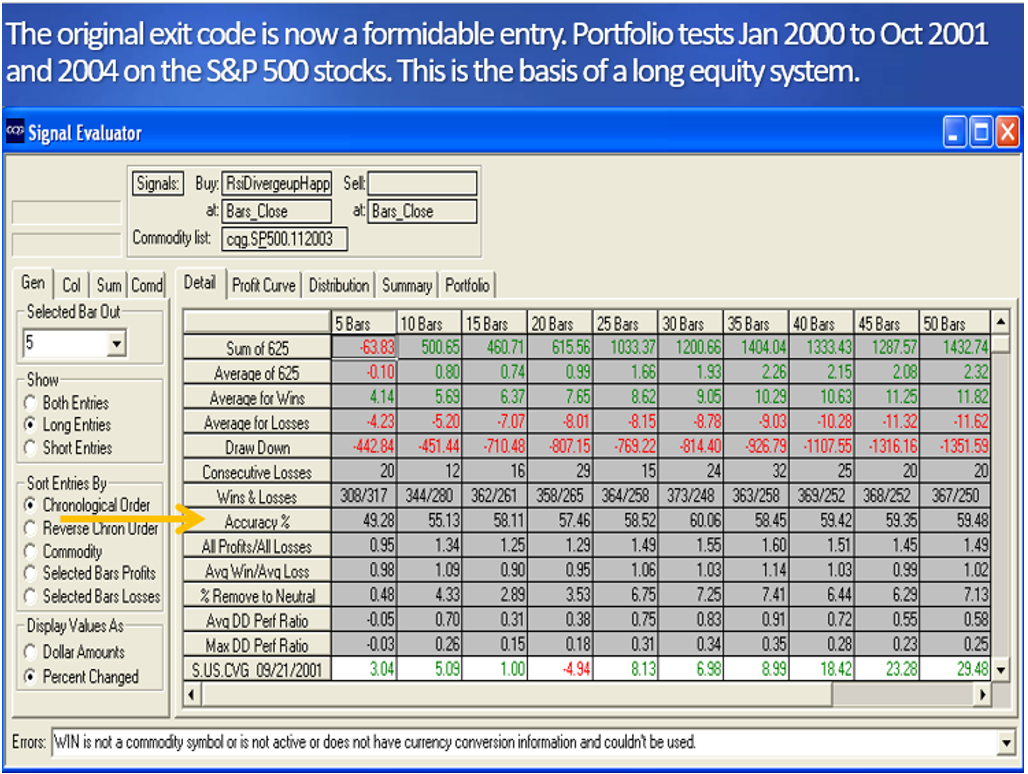
When building trading models a common error is to focus mainly on entry signals. Experience told me that exit methodology and sound money management will have far more effect on individual model… more
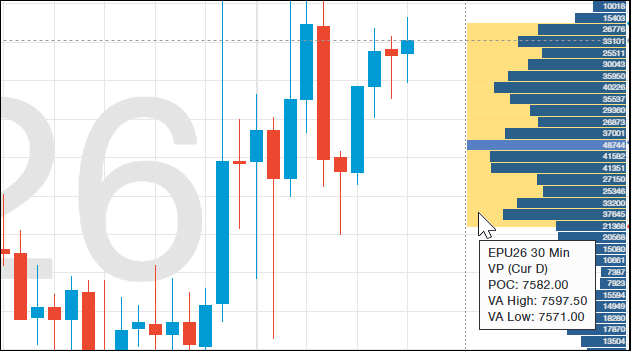
This post details CQG One's Volume Profile Study.
Once applied to a chart, the study calculates the Profile's Value Area and Point of Control (POC).
The value area begins calculating… more

This midweek look shows the Nikkei 225 (Osaka), Sep 26 contract, with a loss of -1.48%. The best performer in the US market is the E-mini Dow, Sep 26 contract showing a gain of +0.02%. The… more
Midweek, the OSE 10 Year JGB, Sep 26 contract is up +0.60%. The best performer in the US market is the 5yr US Treasury Note (Globex), Sep 26 contract, which is higher by +0.12%. The best… more
Each Wednesday this article will be updated with the current seasonal study using CQG's Seasonal analysis applied to the Soybean, Wheat and Corn markets. You can download the CQG pac providing the… more