This post details a Microsoft Excel dashboard that tracks the day's performance of the holdings of the iShares Expanded Tech-Software Sector ETF (Symbol: IGV).
From the iShares website regarding the objective of the ETF: “The iShares Expanded Tech-Software Sector ETF seeks to track the investment results of an index composed of North American equities in the software industry and select North American equities from interactive home entertainment and interactive media and services industries.”
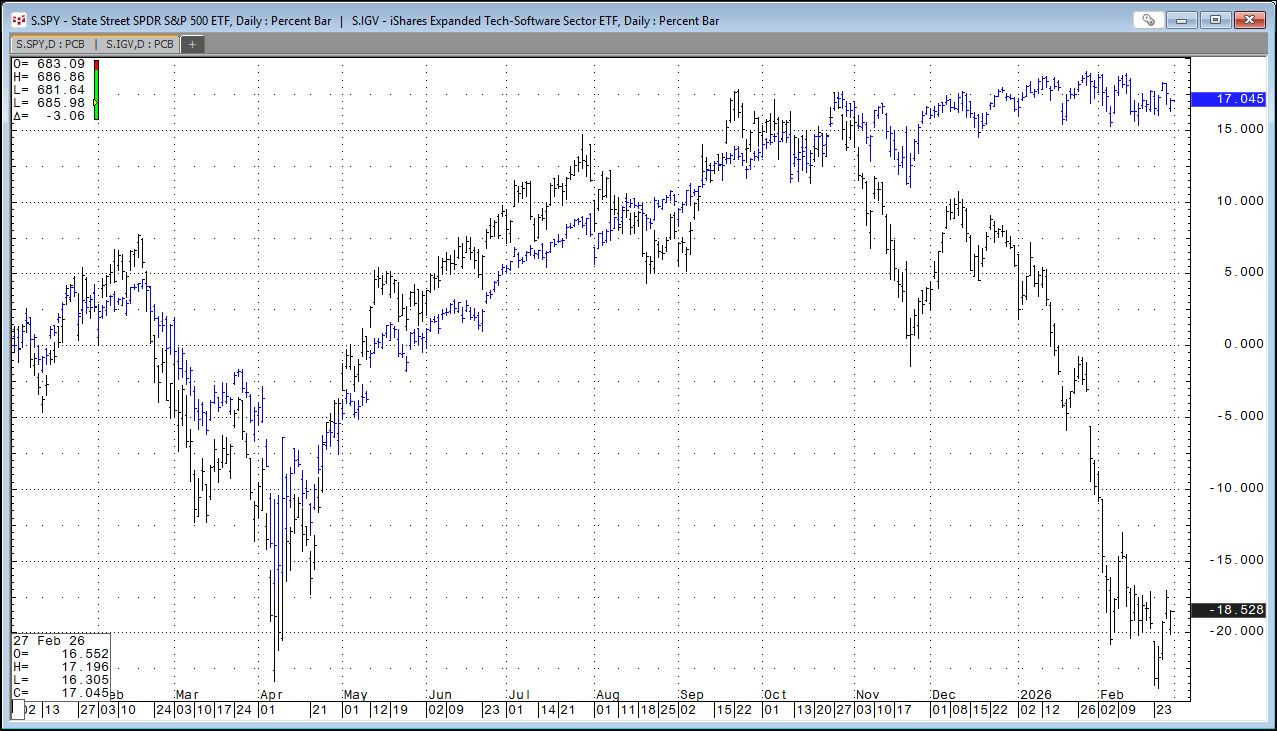
The image below displays the IGV (Black) ETF's performance compared to the S&P 500 ETF (Blue) from the end of 2024. The decline is due to the uncertainty introduced by AI and the impact on SaaS companies. Software as a Service (SaaS) delivers cloud-based applications over the internet on a subscription basis.
Here is a list of the current top ten holdings:
| Ticker | Company | Weight (%) |
|---|---|---|
| MSFT | MICROSOFT CORP | 9.48 |
| PLTR | PALANTIR TECHNOLOGIES INC CLASS A | 8.17 |
| CRM | SALESFORCE INC | 7.74 |
| ORCL | ORACLE CORP | 7.61 |
| PANW | PALO ALTO NETWORKS INC | 4.93 |
| APP | APPLOVIN CORP CLASS A | 4.91 |
| ADBE | ADOBE INC | 4.50 |
| INTU | INTUIT INC | 4.48 |
| CRWD | CROWDSTRIKE HOLDINGS INC CLASS A | 3.97 |
| NOW | SERVICENOW INC | 3.83 |
Here are the top 10 performers as of 2/27/2026 for 2026:
| Symbol | Company | 2/27 % | |
|---|---|---|---|
| 1 | S.US.WULF | Terawulf Inc Cmn | 41.17% |
| 2 | S.US.YOU | Clear Secure Inc. | 38.65% |
| 3 | S.US.RIOT | Riot Platforms Cmn | 28.57% |
| 4 | S.US.OS | Onestream Cl A Cmn | 28.35% |
| 5 | S.US.RNG | Ringcentral Inc. Cls A | 26.21% |
| 6 | S.US.AUR | Aurora Innov Cmn A | 21.88% |
| 7 | S.US.ADEA | Adeia Inc Cmn | 19.94% |
| 8 | S.US.CORZ | Core Scientific Cs | 16.55% |
| 9 | S.US.HUT | Hut 8 Corp. Cs | 15.87% |
| 10 | S.US.IDCC | Interdigital Inc Cm | 15.12% |
Here are the bottom 10 performers as of 2/27/2026 for 2026:
| Symbol | Company | 2/27 % | |
|---|---|---|---|
| 104 | S.US.NABL | N-Able, Inc. | -41.18% |
| 105 | S.US.BRZE | Braze, Inc. Cmn A | -44.62% |
| 106 | S.US.PD | Pagerduty, Inc. | -46.15% |
| 107 | S.US.KVYO | Klaviyo, Inc. | -46.38% |
| 108 | S.US.ASAN | Asana, Inc. | -48.21% |
| 109 | S.US.INTA | Intapp, Inc. Cmn | -51.05% |
| 110 | S.US.TEAM | Atlassian Cls A Cs | -53.66% |
| 111 | S.US.PAR | Par Technology Corporation | -54.82% |
| 112 | S.US.U | Unity Software Inc. | -58.73% |
| 113 | S.US.RPD | Rapid7 Inc Cmn Stk | -59.08% |
Below is an image of the downloadable Excel Dashboard. During the trading session, the Excel dashboard dynamically ranks the individual stocks held by IGV.
The Excel dashboard displayed below shows the top fifteen positive and bottom fifteen negative performers as histogram bar charts, along with their respective net percent change for today's trading session.
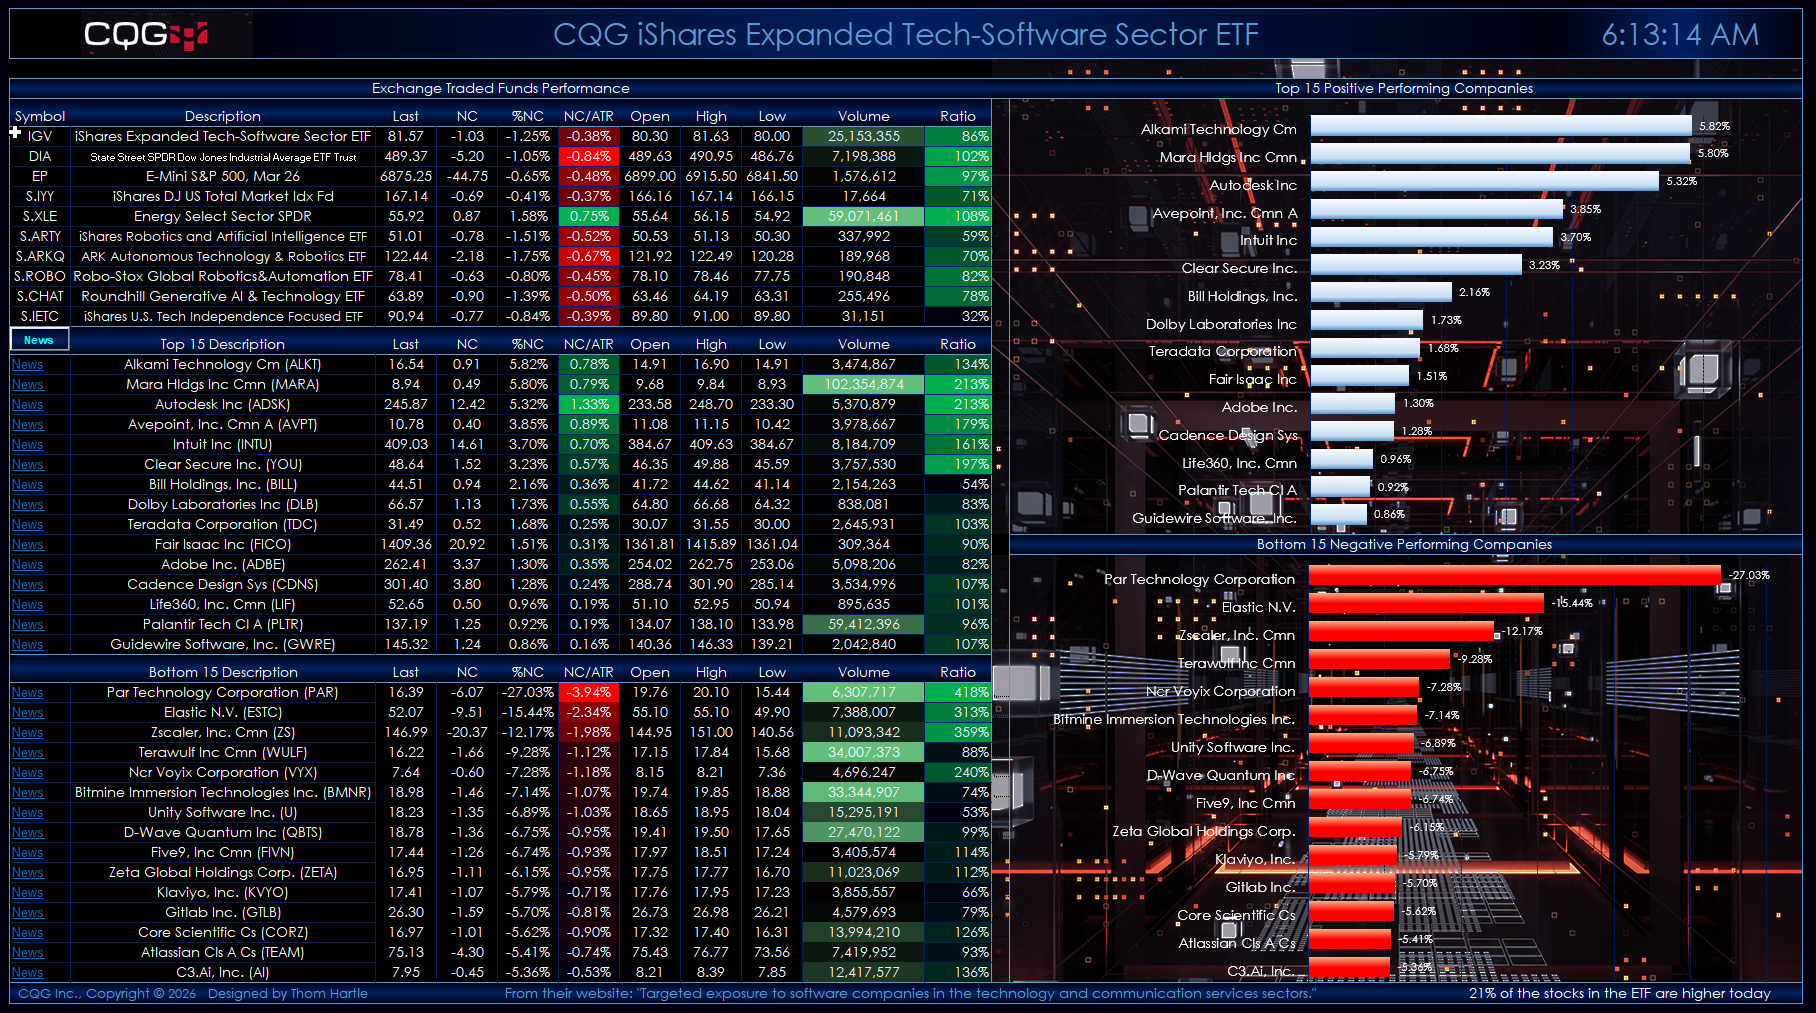
The top section of the quote display allows you to enter your own symbols.
The second section displays the top fifteen performers. The third section displays the bottom fifteen performers.
Quote data includes today's net change as a ratio to the 21-day Average True Range study. Next to today's traded volume is a column that calculates the ratio of today's volume versus the 21-day average of the volume. This ratio column gives you a sense of how active today's trading is relative to recent history. Readings of 100% and higher indicate active trading.
A key feature next to each company name is a link to Yahoo Finance. Clicking the News link will take you to the Yahoo page for that symbol. Note that this could take approximately 30 seconds to open in a browser. Turning off Extensions in your browser will make this happen faster.
If you open another Excel spreadsheet, then this dashboard will no longer be the active spreadsheet. The macro that updates the links and ranks the stocks by performance will stop. To start the macro, simply click the News toolbar button in the first column.
The current holdings are as of 2/26/2026. There is a Symbols tab with instructions detailing where to download the latest posted spreadsheet with the current holdings and steps to update the dashboard.
Make sure to lower your Excel Realtime Data (RTD) throttle to 50 milliseconds or lower. Learn how to do that here.
Requires CQG Integrated Client or CQG QTrader, data enablements for the NYSE and Nasdaq and Excel 365 locally installed, not in the Cloud.