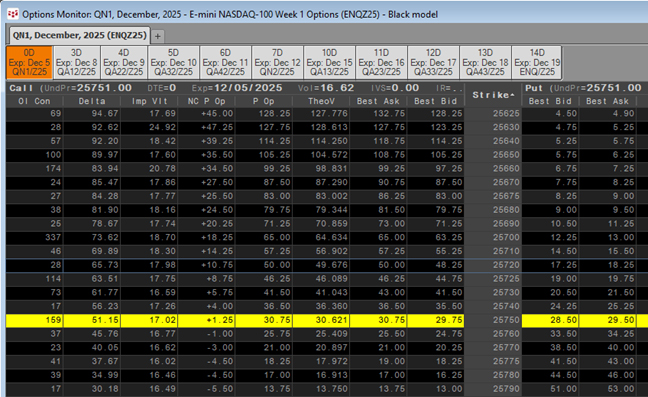
The major exchanges (CME and ICE) are moving to daily options. The Options Monitor lets you request the option prefixes by the underlying symbol and then they are displayed as tabs in days-to… more
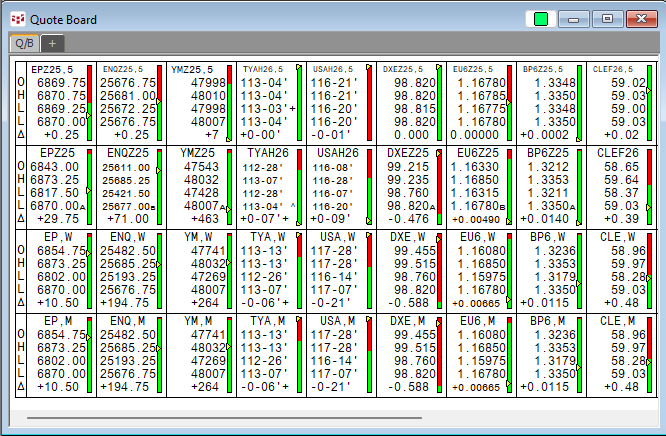
The CQG Quote Board is a classic quote display providing the open, high, low, last, and net change from the prior close.
One feature unique to the CQG Quote Board is a symbol entered… more
Midweek, the OSE 10 Year JGB, Dec 25 contract is down -0.47%. The best performer in the US market is the 2yr US Treasury Note (Globex), Dec 25 contract, which is down -.01%. The best… more
This midweek look shows the Nikkei 225 (Osaka), Dec 25 contract with a decline of -0.68%. The best performer in the US market is the E-mini NASDAQ-100, Dec 25 contract showing a gain of +0.… more
Each Wednesday this article will be updated with the current seasonal study using CQG's Seasonal analysis applied to the Soybean, Wheat and Corn markets. You can download the CQG pac providing the… more
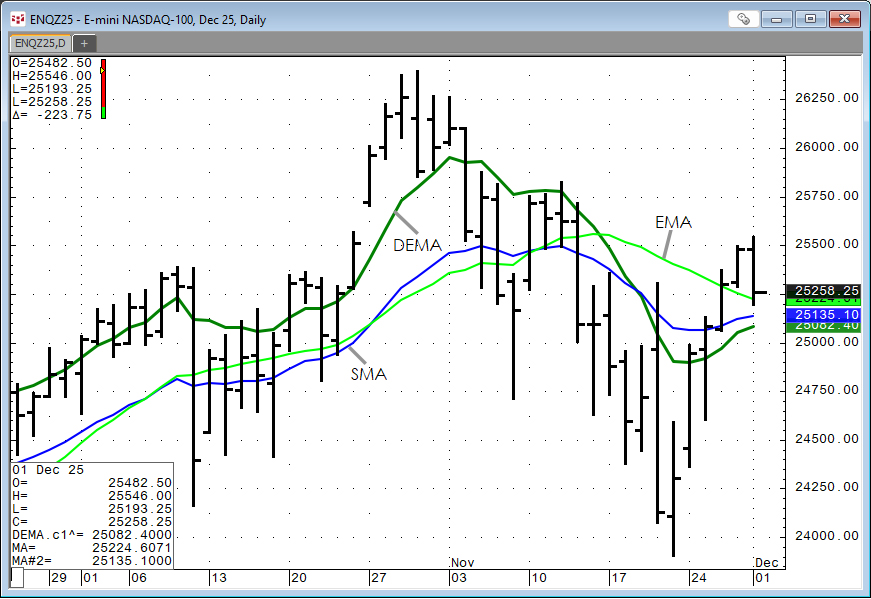
The Double Exponential Moving Average study is a moving average calculation that reduces the lag associated with other moving averages. The Double Exponential Moving average is calculated as the… more
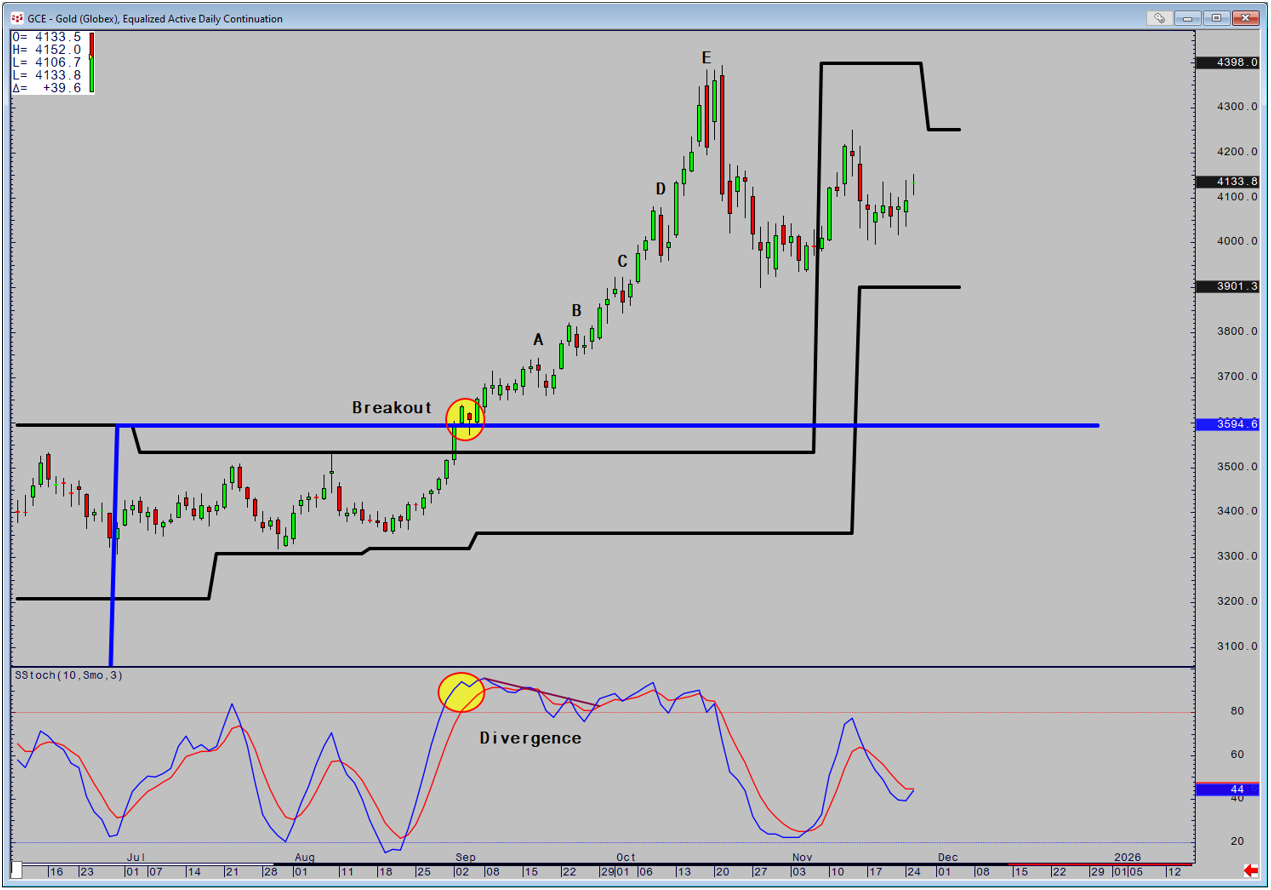
Divergence can be likened to being able to see an eel in clear water. It's highly visible but try picking it up and holding on. If divergence is to be used as part of your armory it must be linked… more
This midweek look shows the Nikkei 225 (Osaka), Dec 25 contract with a +2.79% gain. The best performer in the US market is the E-mini NASDAQ-100, Dec 25 contract showing a gain of +4.16%.… more
Midweek, the OSE 10 Year JGB, Dec 25 contract is down -0.13%. The best performer in the US market is the 30yr US Treasury Bond (Globex), Dec 25 contract, which is up +0.88%. The best… more
