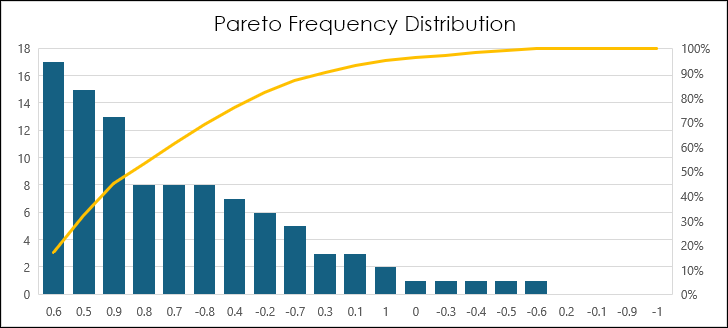
A Pareto chart is a histogram chart displaying columns sorted in a descending order and a line representing the cumulative total percentage. Pareto charts highlight the largest factors in a data… more
This midweek snapshot shows a mostly negative performance for the Equity Index futures markets. The best performer in the Japanese market is the TSE REIT Index, Sep 24 contract with a +0.78… more
So far this week the Fixed Income futures markets are mostly lower. However, the TSE 10 Year JGB, Sep 24 contract is up +0.73%. The best performer in the US market is the 2yr US Treasury… more
Each Wednesday this article will be updated with the current seasonal study using CQG's Seasonal analysis applied to the Soybean, Wheat and Corn markets. You can download the CQG pac providing the… more
The post "Excel Combining SORTBY, CHOOSECOLS, and TAKE Functions" discusses Excel 365's Dynamic Arrays and the concept of returned data automatically "spilling" into a collection of cells.
… more
Jul 30, 2024, Kevin Darby, vice president of CQG, sat down with John Lothian News at the Options Conference in Asheville, North Carolina to discuss CQG’s advancements and… more
This midweek snapshot shows a positive performance for the Equity Index futures markets. The best performer in the Japanese market is the Nikkei 225 (Osaka), Sep 24contract with a +2.55% %… more
So far this week the Fixed Income futures markets are mostly higher. The TSE 10 Year JGB, Sep 24 contract is up +0.18%. The best performer in the US market is the 30yr US Treasury Note (… more
Each Wednesday this article will be updated with the current seasonal study using CQG's Seasonal analysis applied to the Soybean, Wheat and Corn markets. You can download the CQG pac providing the… more
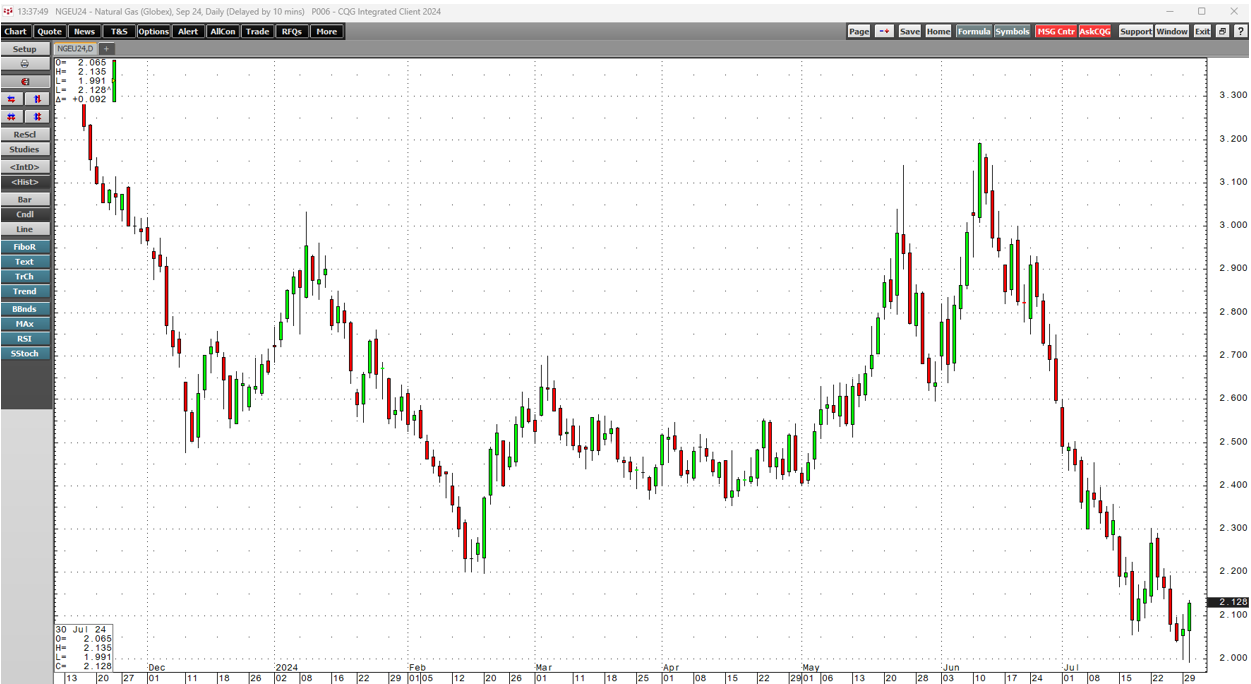
In August 2022, nearby NYMEX natural gas futures prices rose to the highest level since 2008 at over $10 per MMBtu. The rally caused by the war in Ukraine lifted European prices to record highs,… more
