This Microsoft Excel® spreadsheet tracks the constituents of the DJIA Index (symbol: DJIA).
The standard market columns include Last, NC, 5-minute Sparkline charts, %NC, today's session volume, today's volume as a ratio to the 20 moving average of the volume, Bid volume, Best bid, Best ask, Ask volume, open, high and low.
In addition, this dashboard offers a high/low color alert. If the last price is within two cents of the high, then the high price is highlighted with a green background. If the last price is within two cents of the low, then the low price is highlighted with a red background.
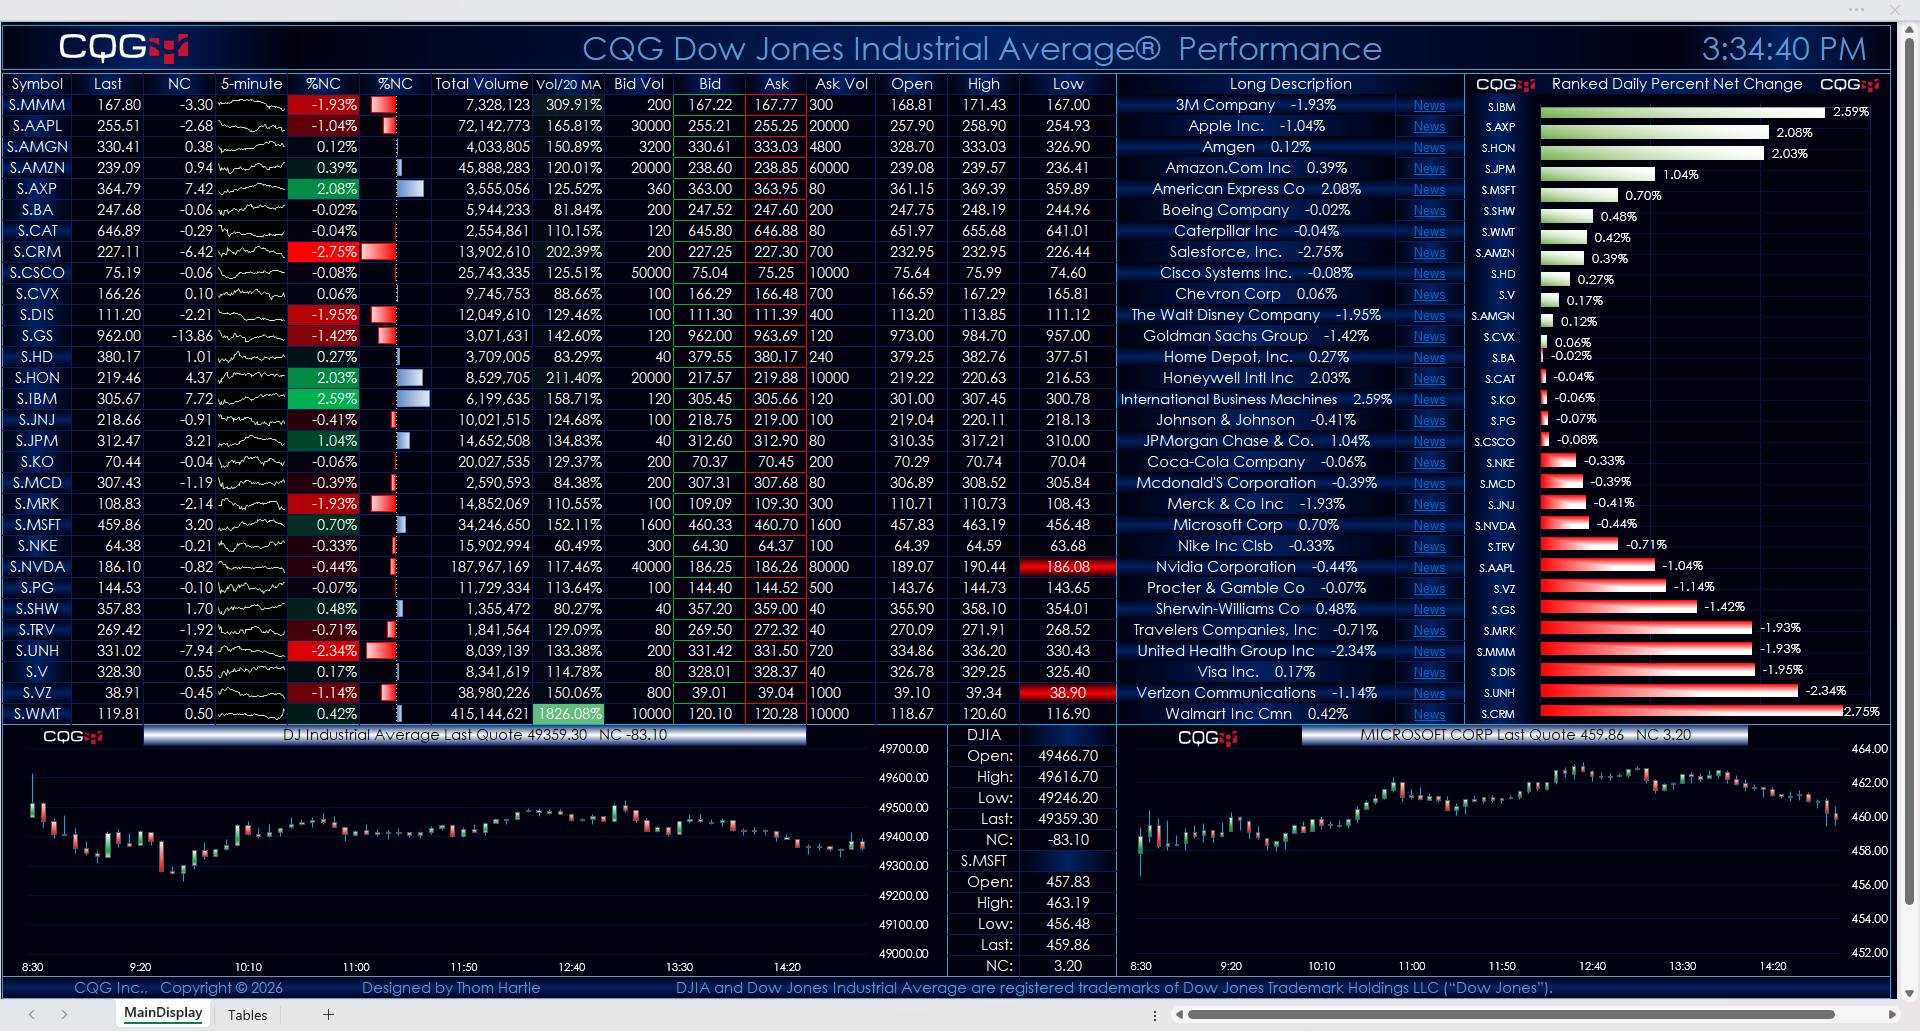
The percent net change column is heat mapped. 5-minute Sparkline charts are next to the Net Change column.
Next to each company name is a link to Yahoo Finance. Clicking the News link will take you to the Yahoo page for that symbol.
Throughout the trading session, the thirty individual stocks are dynamically ranked and displayed in the histogram bar chart with their respective net percent change for today's trading session.
There are two 5-minute open, high, low, and close charts updated throughout the trading session. The left chart is the DJIA. The right chart can display any symbol you enter. All capital letters are required when entering symbols.
The tab Tables is pulling in market information from the Main Display and a data tab.
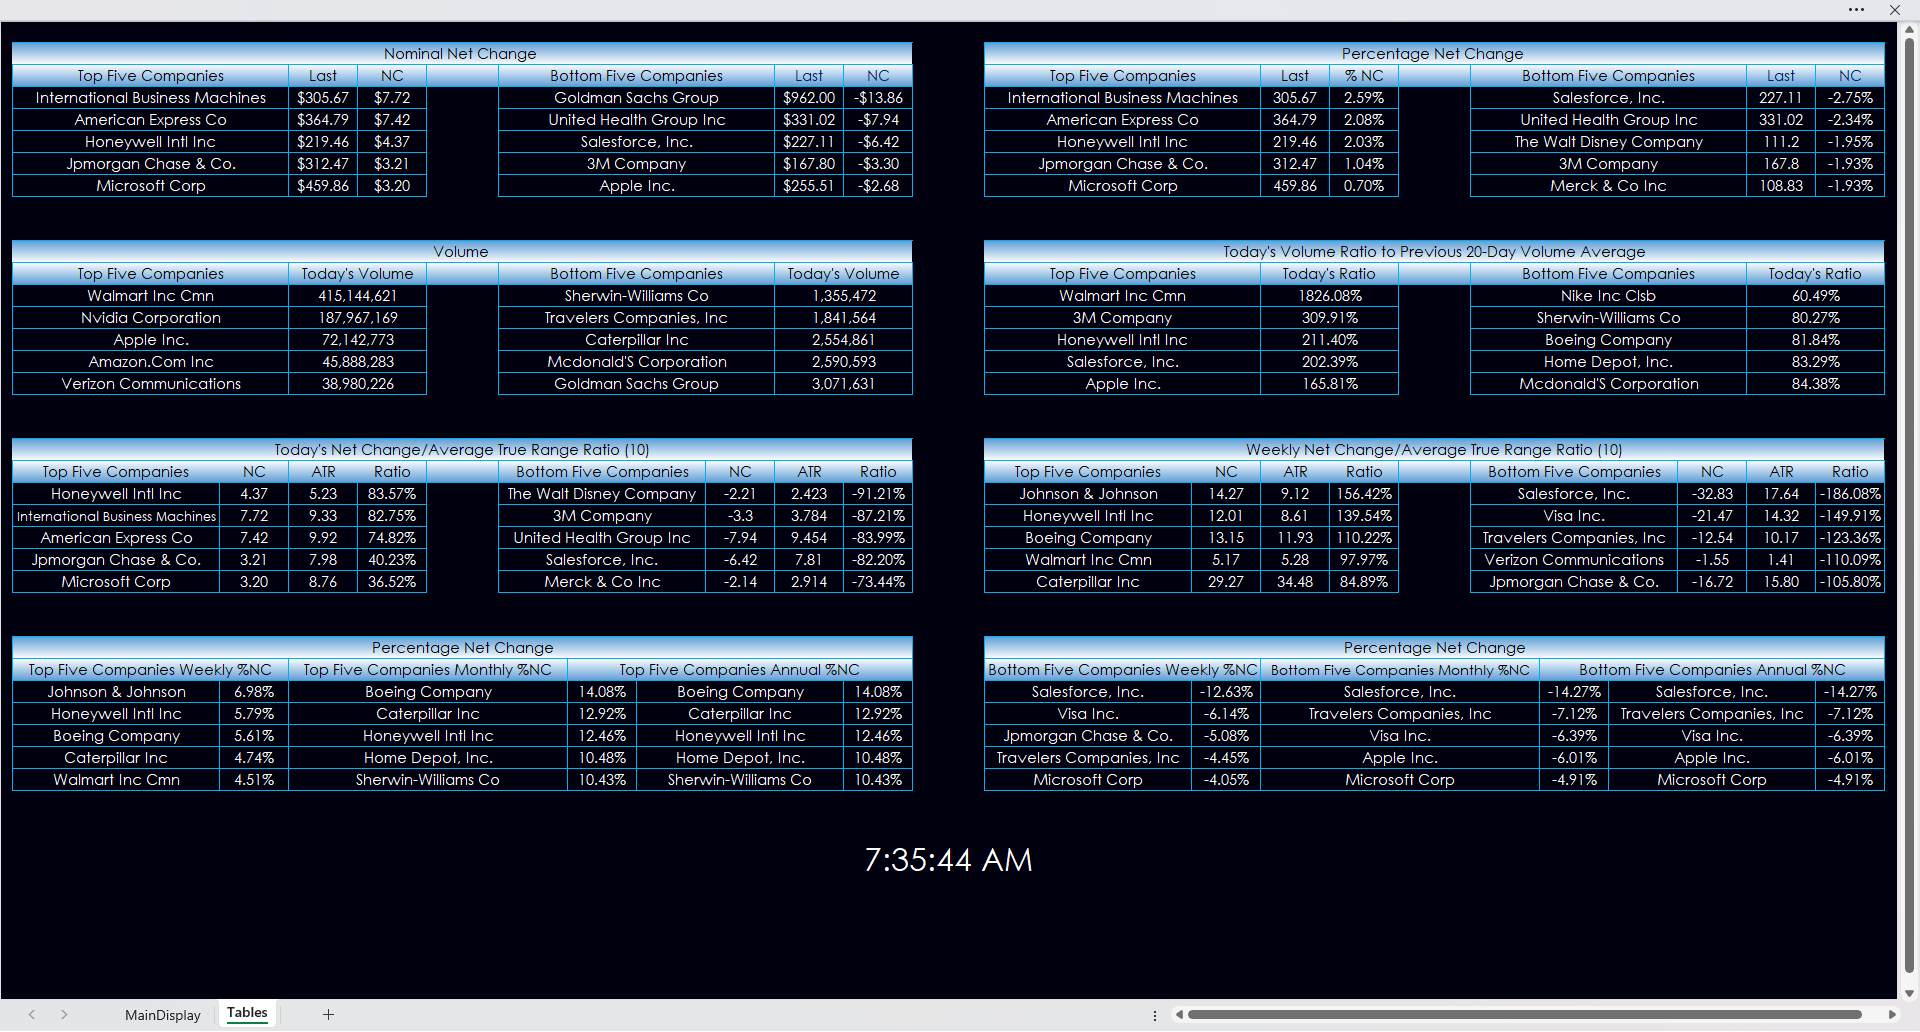
The data is pulled in using Excel functions: TAKE, CHOOSECOLS, and SORT BY.
These functions are detailed in the post: Excel Combining SORTBY, CHOOSECOLS, and TAKE Functions.
Each section in the Tables tab shows the top five and the bottom five performing stocks in each category:
- Nominal Net Change: The net change for the session.
- Today's Percentage Net Change: The percentage net change for the session.
- Volume: The session's volume.
- Today's Volume Ratio to Previous 20-Day Volume Average: A ratio to determine high volume sessions.
- Today's Net Change/Average True Range Ratio (10): A ratio to determine large net daily changes.
- Weekly Net Change/Average True Range Ratio (10): A ratio to determine large net weekly changes.
- Weekly, Monthly and Annual Percentage Net Change: Top five companies.
- Weekly, Monthly and Annual Percentage Net Change: Bottom five companies.
Make sure to lower your Excel RealTimeData (RTD) throttle to 50 milliseconds or lower. Learn how to do that here.
Requires CQG Integrated Client, data enablements for the NYSE and NASDAQ.
DJIA and Dow Jones Industrial Average are registered trademarks of Dow Jones Trademark Holdings LLC ("Dow Jones").