Traditionally, divergence is quantified by taking the relationship between the high in an uptrend and low in a downtrend and comparing that to an indicator of momentum based on the closing value. All well and good, but this narrow definition prevents the opportunity to see whether a trend is diverging through a different relationship to the indicator. The variety of divergence-based studies that I created allow for far more flexibility and experimentation, not only on what the indicators value is based on, but also the ability to double smooth momentum so that signals can be minimised to when that smoothing crosses above or below the primary indicator.
As a study it looks unilluminating as it either flatlines at zero or produces a value of one if the divergence is true. This is a waste of screen real estate, so it is therefore necessary to build code that will mark the Candle when the divergence is true. By separating out the relationships it tells you how many are diverging and therefore how powerful the signal is.
Below is the Set-Up variables for the creation of a Rsi Divergence.
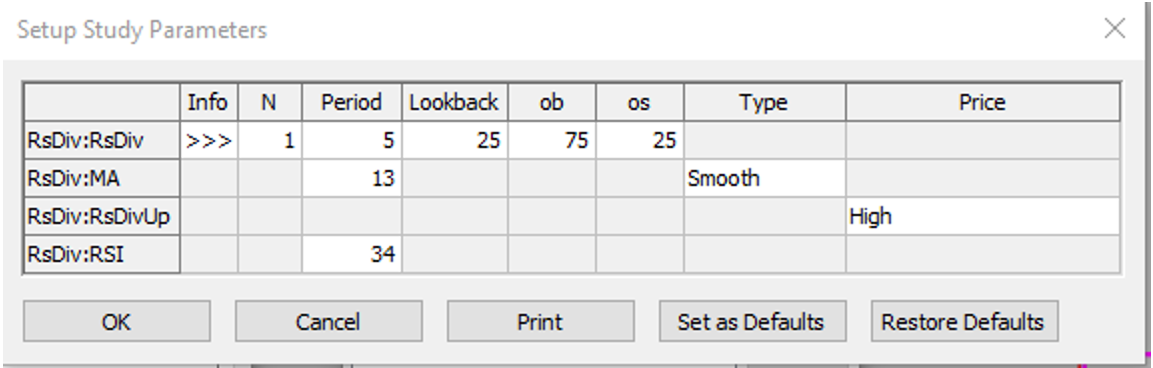
N refers to the number of divergences that have to occur. The default is 1 and it is rare that this should ever be changed unless using a very sensitive indicator such as the Fast Stochastic.
Period allows for some flexibility within the divergence and defaults to 5. This means that the divergence does not have to be symmetrical in nature
Lookback is the limit of bars that the indicator and price could have diverged. Increasing the number raises the potential number of divergence patterns.
OB and OS applies to linear calculations and at what point the pattern will reset. E.g. If the Rsi Reaches 75 it will not look for positive divergences until it is back below 75.
Indicators that only have one value of reference such as the Rsi, are prone to constantly diverging and giving false signals. Therefore in order to mitigate this, there is the option to place another indicator on the Rsi. In this case it is a 13-period Smoothed Moving Average, placed on a 34 Period Rsi. This is a crucial element as it means that the study is only looking for divergence when the average crosses the Rsi whilst allowing for the 5-bar period allowance. This greatly limits the number of divergence patterns that will be true.
Finally, Price is set at the High as this is a down Divergence pattern it is looking for.
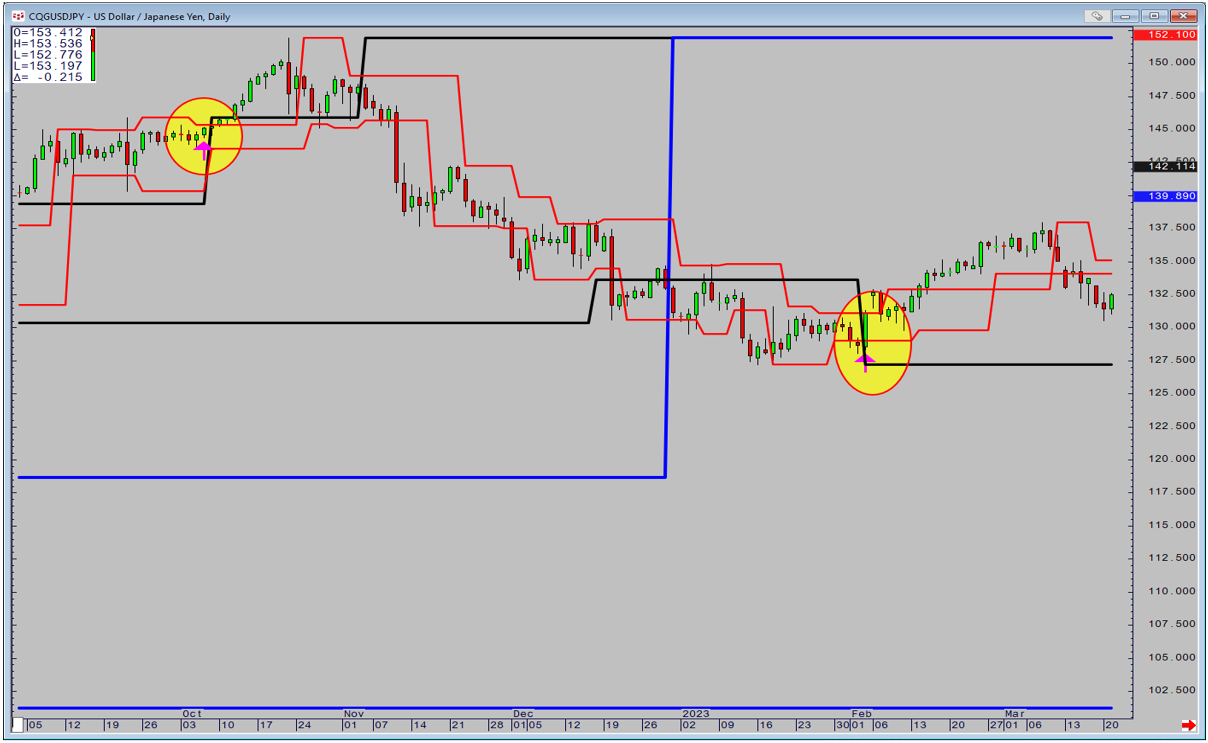
The Dollar Yen chart shows more traditional divergence that is going through the low. Note that as no value is placed on the Rsi itself there can be divergence as a continuation pattern as shown in the first signal and against the trend in the second one.
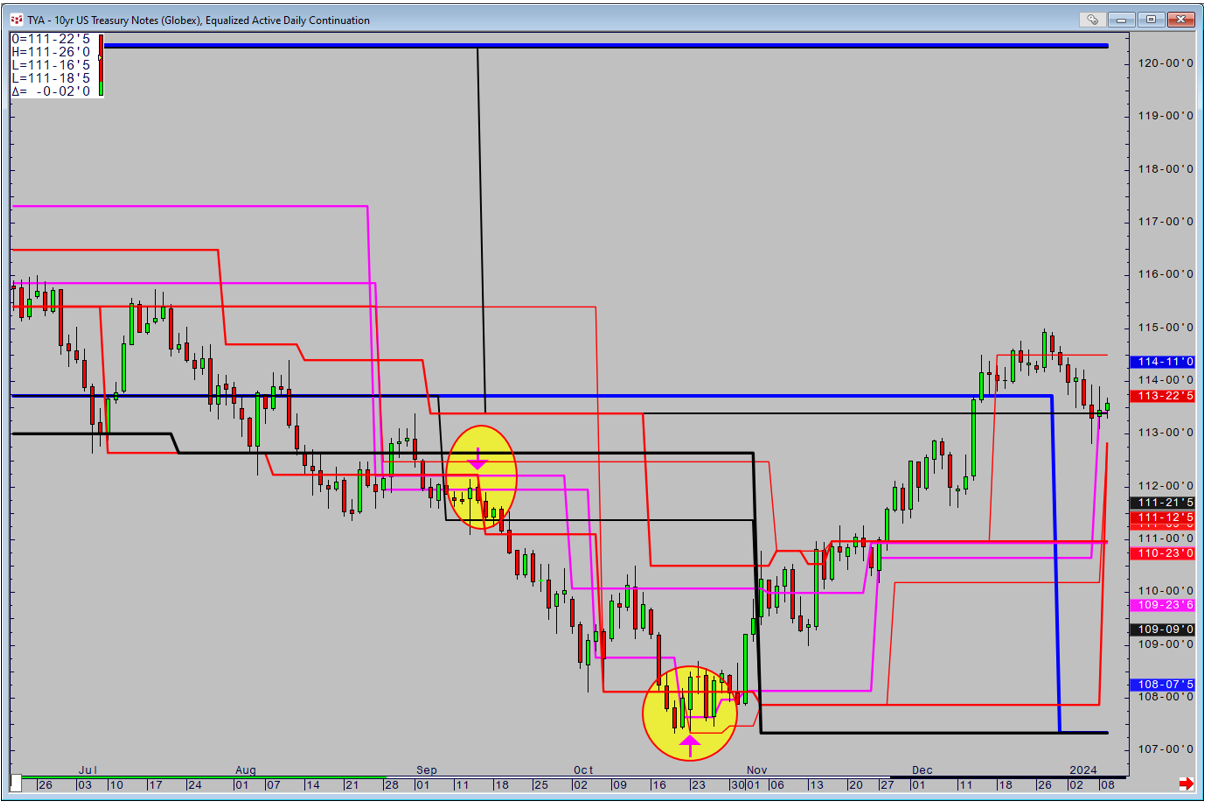
The 10-Year Note shows divergence as a continuation when plotted through the Highs and then one at the Lows.
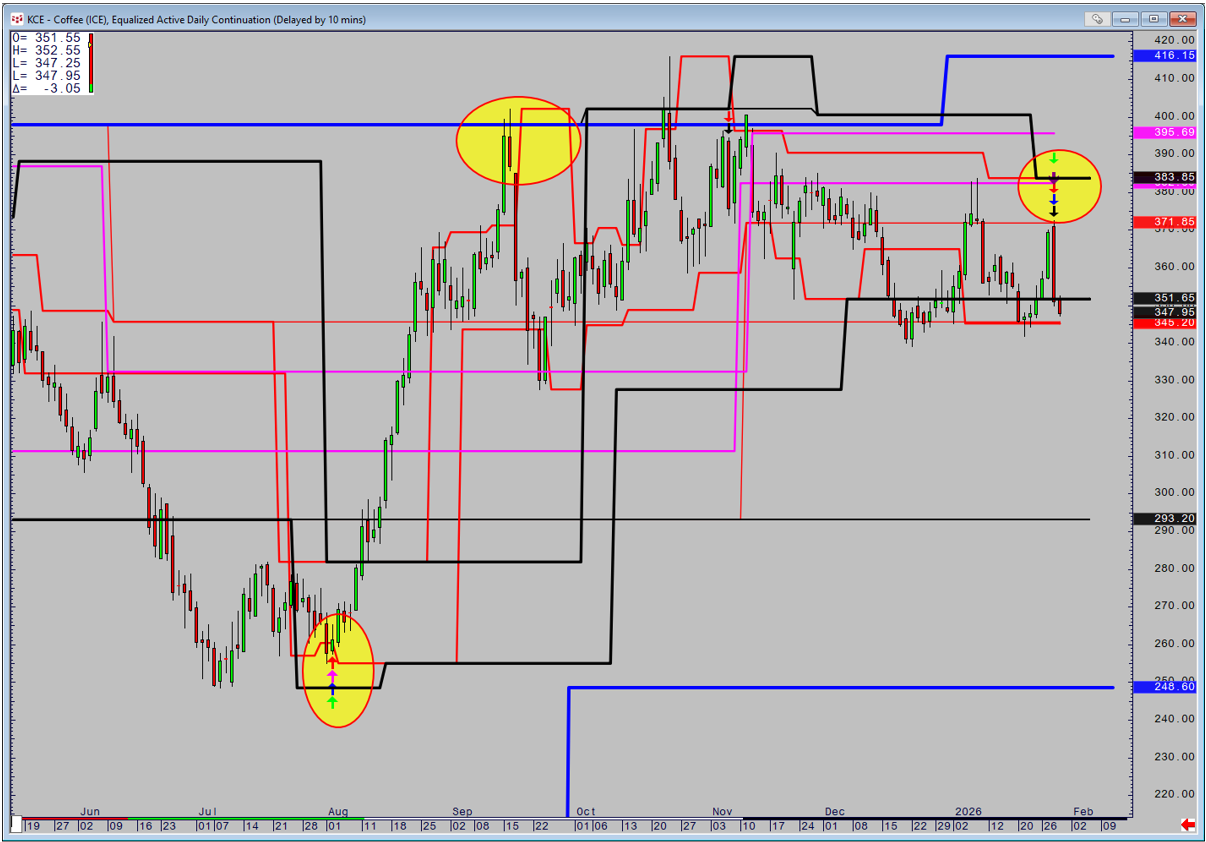
The ability to place the divergence through different relationships of price can be used to gauge the strength of the pattern. The first pattern is diverging through the High/Low/Open and Close and is also close to final major weekly based support (black line). The ultimate target is the monthly based resistance (blue line). This week has seen the opposite negative pattern which will be confirmed with we close below last week low. The target will be the weekly based support at 293.20.
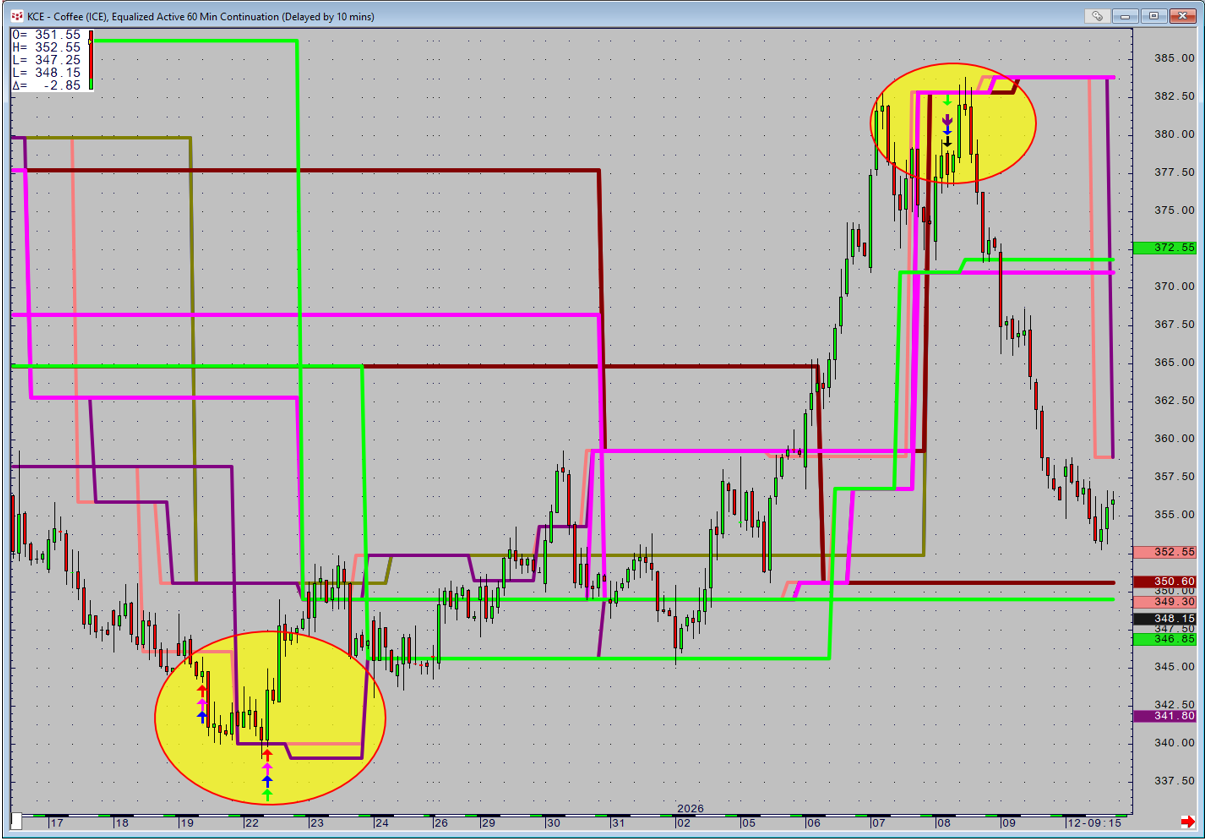
It can also be applied to intraday charts. Using an equalised active continuation as a 60-minute the lines are plotting the supports and resistances through range and volume on a 120,240,360 and 720-minute basis (green, pink, brown and red). The first pattern fails but we have not created support. By the second signal we have formed support and price makes a low. Finally, after a strong rally that had no resistance, it finally forms and qualifies the negative signal.