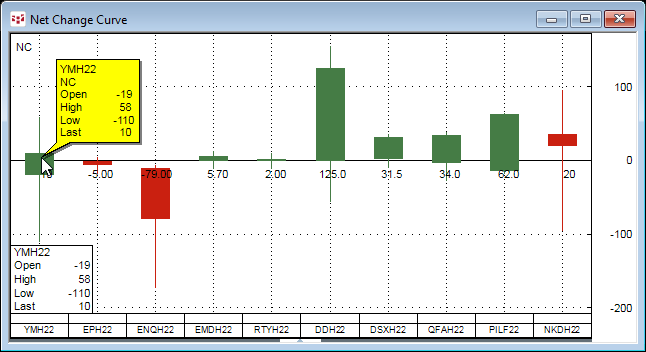
The Net Change Curve chart displays a collection of symbols’ net price change or net percentage change making it easy to compare each market’s current sessions’ performance.
In addition, you can choose to set the net change curve chart to the current time and see the performance from that starting time.
For more details, please read the Help file and view this Workspace Post with a video.