The Adaptive Moving Average (AMA) was developed by American quantitative financial analyst and author Perry J. Kaufman. The AMA study is like the exponential moving average (EMA), except the AMA uses a scalable constant instead of a fixed constant for smoothing the data.
The formula for the exponential moving average is:
EMA today = C*(price today – EMA yesterday) + EMA yesterday
C is a smoothing constant where C = 2/(N+1). N is a number used to approximate a simple moving average. C ranges between 0 and 1. For example, to use an EMA with similar characteristics to a 10-bar simple moving average, use N = 10.
Therefore, C = 2/(10+1) = 2/11 = 0.1818.
The formula for the AMA is:
AMA(today) = SC*(price today – AMA yesterday) + AMA yesterday
Where SC is a Scalable Constant.
The scalable constant, which has a range between 0 and 1, weights the AMA calculation. The AMA uses two constants based on a fast EMA (short look back period) and a slow EMA (long look back period). This weighting is based on the degree of market direction relative to market volatility. The higher the degree of trending by the market, the more the weighting shifts to the fast exponential moving average constant. If the market is moving in a sideways pattern, then the weighting shifts to the slow exponential moving average constant.
For full calculation details, please read the Adaptive Moving Average Help File.
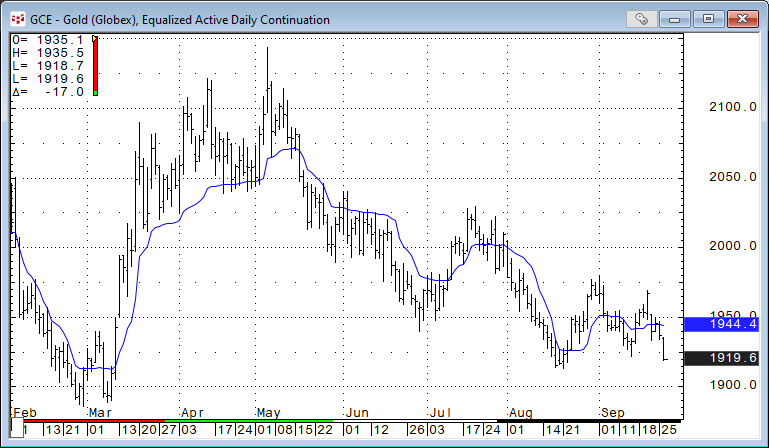
Viewing the image below the AMA is plotted using the default parameters. When the market is trending, either up or down, the AMA calculation does shift to a shorter lookback period and closely tracks the price action. And, when the market moves into a trading range the AMA calculation shifts to a longer lookback period causing the AMA to level off.

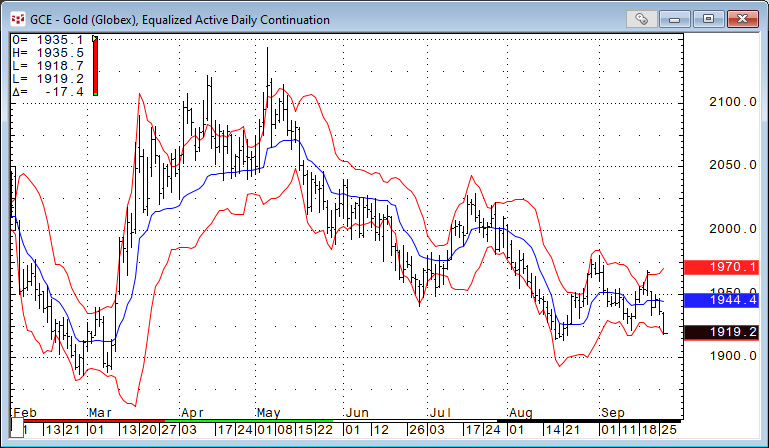
One difference between the AMA study and the moving average study is the AMA study does not have an envelope or trading bands display parameter. The downloadable CQG PAC at the bottom of the article has a custom study where two standard deviations using a 10-bar lookback parameter is added to the 10-bar AMA value and two standard deviations using a 10-bar lookback parameter is subtracted from the 10-bar AMA value. The chart below displays the output of the custom study.

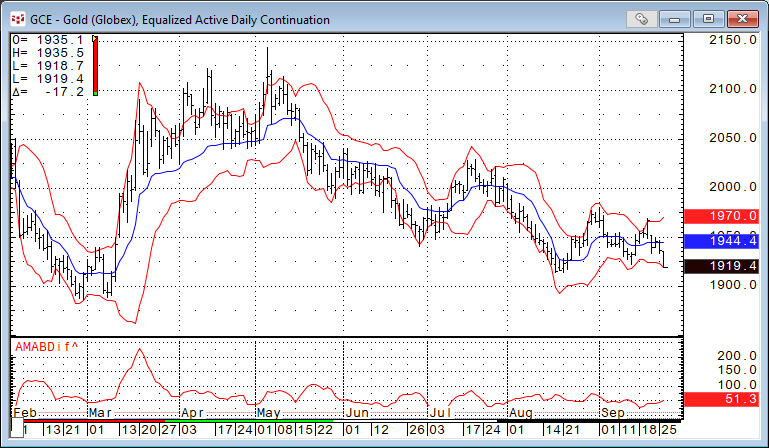
In the article CQG Primer: Bollinger Bands the idea that tracking the difference between the two Bollinger Bands may present opportunities was offered. The basic idea is that when the two bands narrow then the market volatility indicates consolidating price action, and this situation could be a precursor to a new trend. The CQG PAC includes this study displayed in the image below.

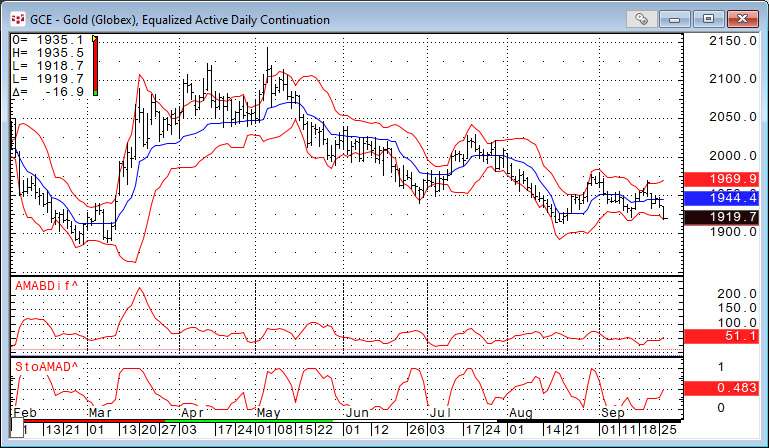
The Bollinger Band article also detailed a custom study to aid with identifying wide and narrow Bollinger Band difference. The same study is applied to the AMA Bolinger Band difference using a 20-bar lookback for the ranges:
The StocAMAD study is (The current AMABDif minus the lowest AMABDif)/(highest AMABDif minus the lowest AMABDif) and is displayed in the image below.

The Adaptive Moving Average is an interesting study to smooth the data and indicate the current trend. It is one of the studies found in CQG’s Basic Studies group.