The Excel MAXIF function returns the maximum value from a range of cells and a criteria range. For example. The downloadable sample at the bottom of this post is determining the best performance of stocks by sectors in the S&P 500 and the NASDAQ 100. The performance statistics are annual, monthly and weekly performance.
The MAXIF function can work with multiple criteria. The MAXIFS function is available in Excel 2019, Excel 2021, and Excel for Microsoft 365 on Windows and Mac.
The sectors and their constituents used in this sample spreadsheet were from the Sector SPRD website.
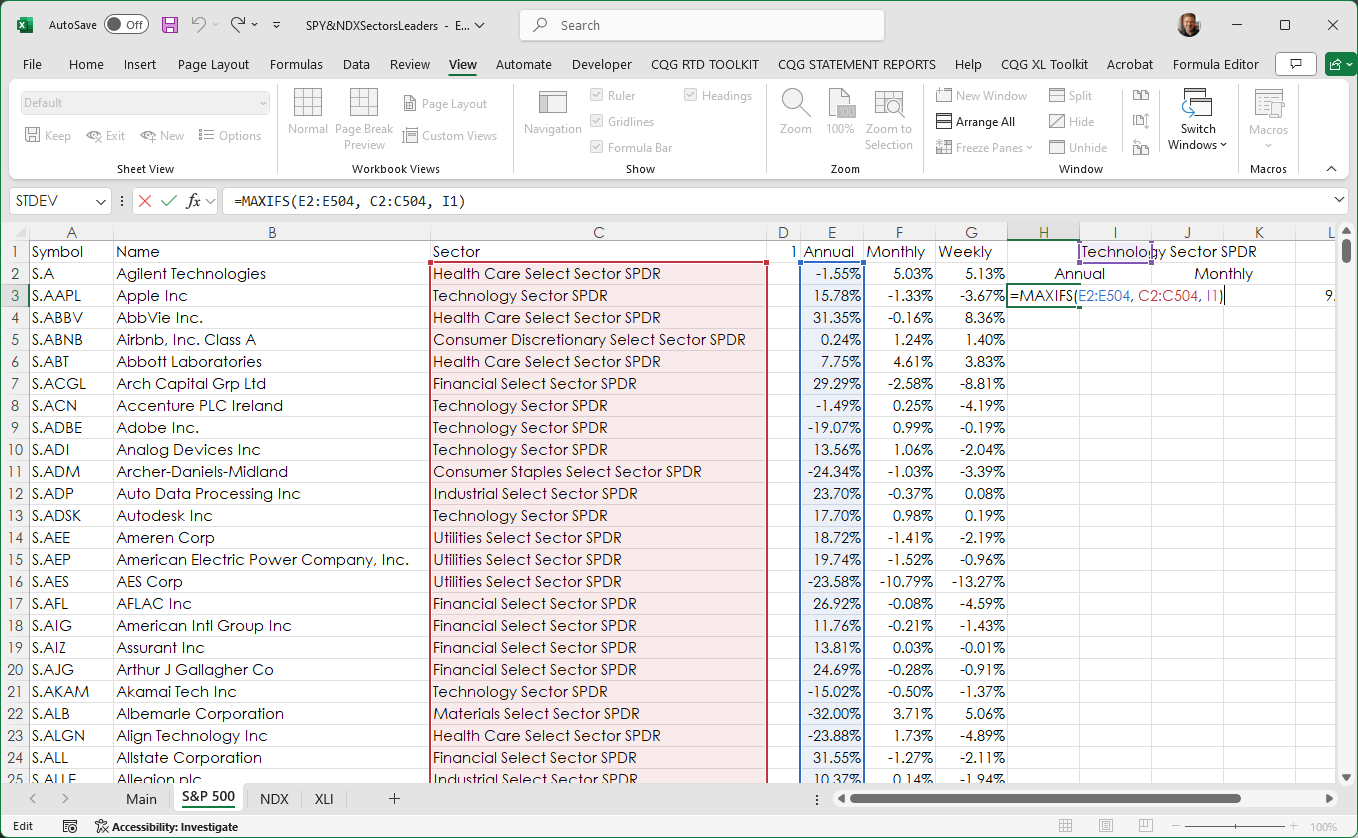
An example of using the MAXIF function is presented using the S&P 500 tab. Column E is the percentage gain of loss for the year using the Percent Bar RTD function.
=IFERROR(RTD("cqg.rtd",,"StudyData",$A2, "PCB","BaseType=Index,Index="&$D$1&"", "Close", "A",,"all",,,,"T")/100,"")The S&P 500 tab uses the MAXIF function in cell H3 to find the Technology Sector SPDR (Cell I1) in column C2:C504 and the maximum value found in column E2:E504.
=MAXIFS(E2:E504, C2:C504, I1)
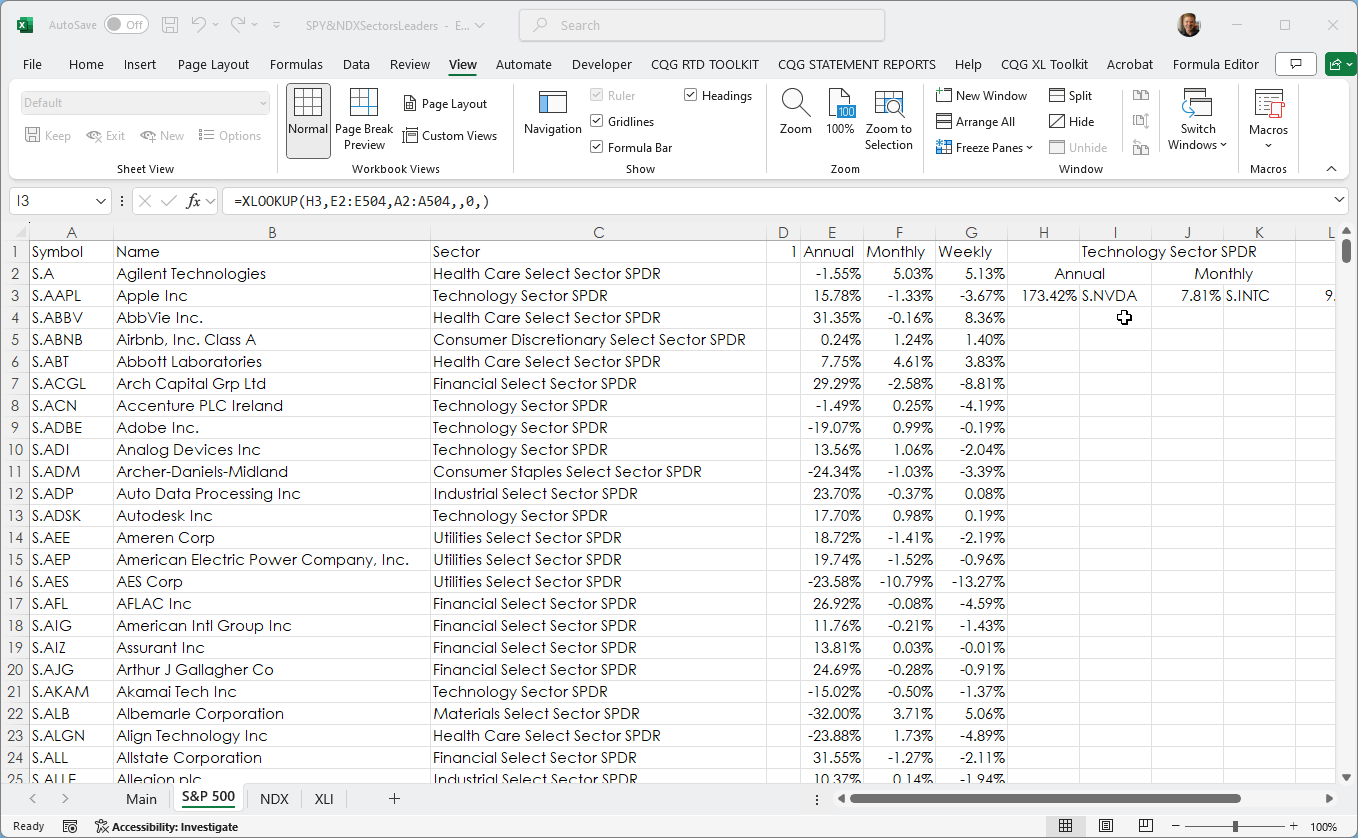
Then the XLOOKUP function is used to locate the value in cell H3 and the appropriate symbol from Column A.
=XLOOKUP(H3,E2:E504,A2:A504,,0,)
This process is repeated for monthly and weekly performance on both S&P 500 and the NASDAQ 100 tabs.
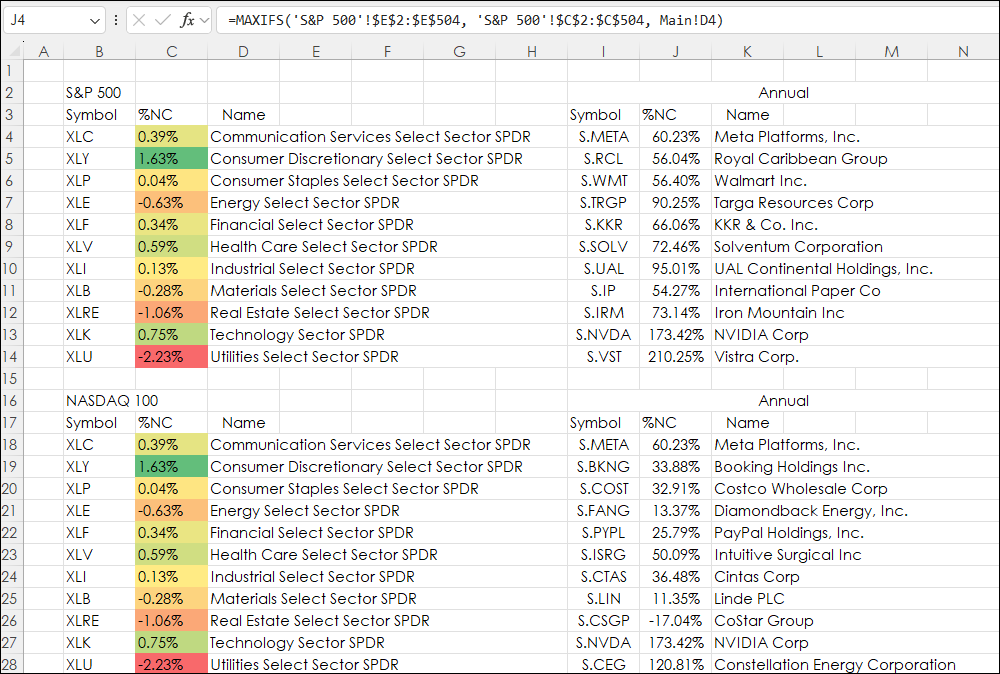
On the Main tab:
- Column B: Sector Symbols
Column C: %NC
(=IFERROR(RTD("cqg.rtd", ,"ContractData",B4, "PerCentNetLastTrade",, "T")/100,"")- Column D: Name
Column I: Symbol
=XLOOKUP(J4,'S&P 500'!$E$2:$E$504,'S&P 500'!$A$2:$A$504,,0,)
Column J: %NC
=MAXIFS('S&P 500'!$E$2:$E$504, 'S&P 500'!$C$2:$C$504, Main!D4)Column K: Name
=RTD("cqg.rtd", ,"ContractData",I4, "LongDescription",, "T")
This is repeated for the Monthly and Weekly percent net changes for columns O through W (not shown).
This is also repeated for the NASDAQ 100 sectors.
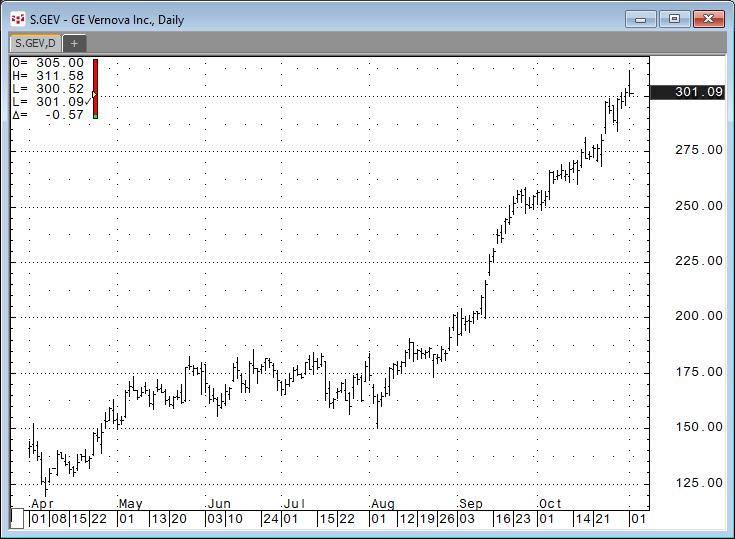
There was an issue with the Industrial Selector. GE Vernova was spun out of General Electric earlier this year. It was added to the S&P 500 and is a member of the Industrial sector.
GE Vernova does not have a year's trading but incorrectly appears as the leader.
To deal with this the XLI tab is the list of constituents for the Industrials sector and the annual percent net change. The column uses the LARGE function, which has a parameter to return the 2nd largest gain.
=LARGE($E$3:$E$80,2)
The MAXIF function does not have this parameter.
Conclusion: The MAXIF function is very useful when the need is to examine a large table of data with a mixture of criteria.
Requirements: CQG Integrated Client or QTrader, and Excel 2019 (locally installed, not in the Cloud) or more recent.


