This post, View Pre and Post Sessions for Stocks, detailed creating a custom session in CQG IC or QTrader to view on a chart pre-market and post market Bid and Ask activity for stocks.
Included with the post was a downloadable CQG PAC to install a page displaying four charts that employed the custom session, and the charts were set to display bids, asks, trades and settlement data.
CQG customers who partner CQG with Excel can create the same data in Excel — the topic of this post.
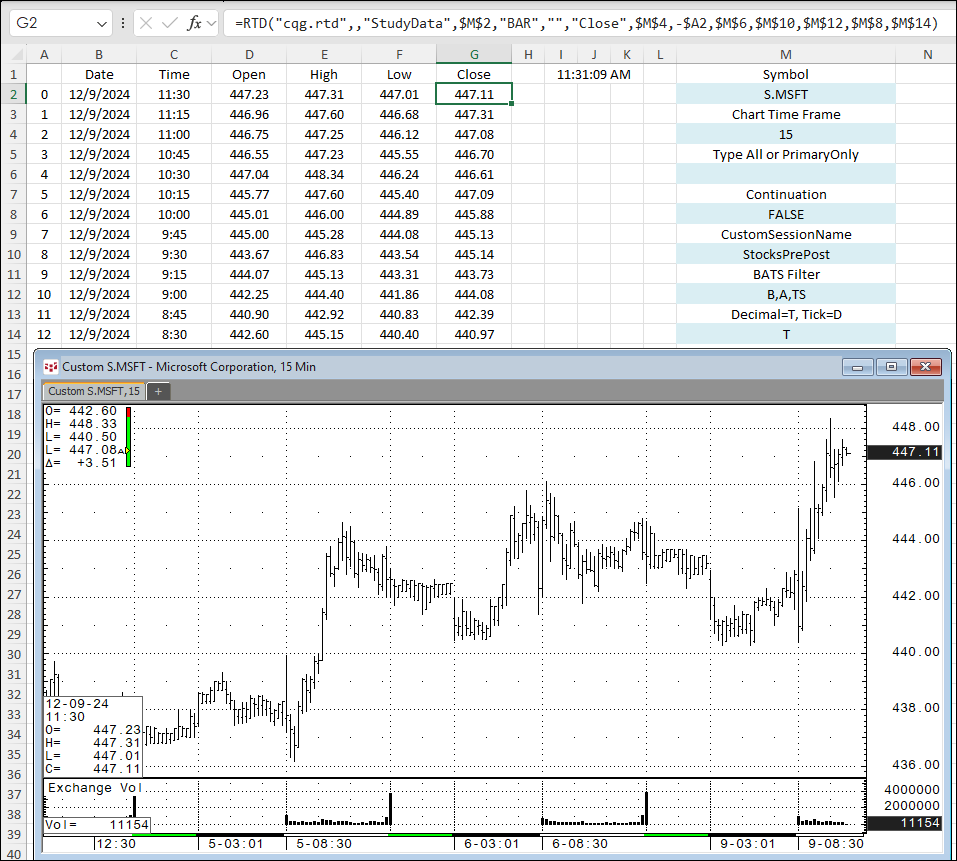
This image below is from the Documentation tab from this post detailing pulling bar data and study data into Excel
The RTD syntax has a “Custom Session” parameter and a “BATS filter” parameter. BATS is B = Bids, A = Asks, TS = Trades and Settlements.
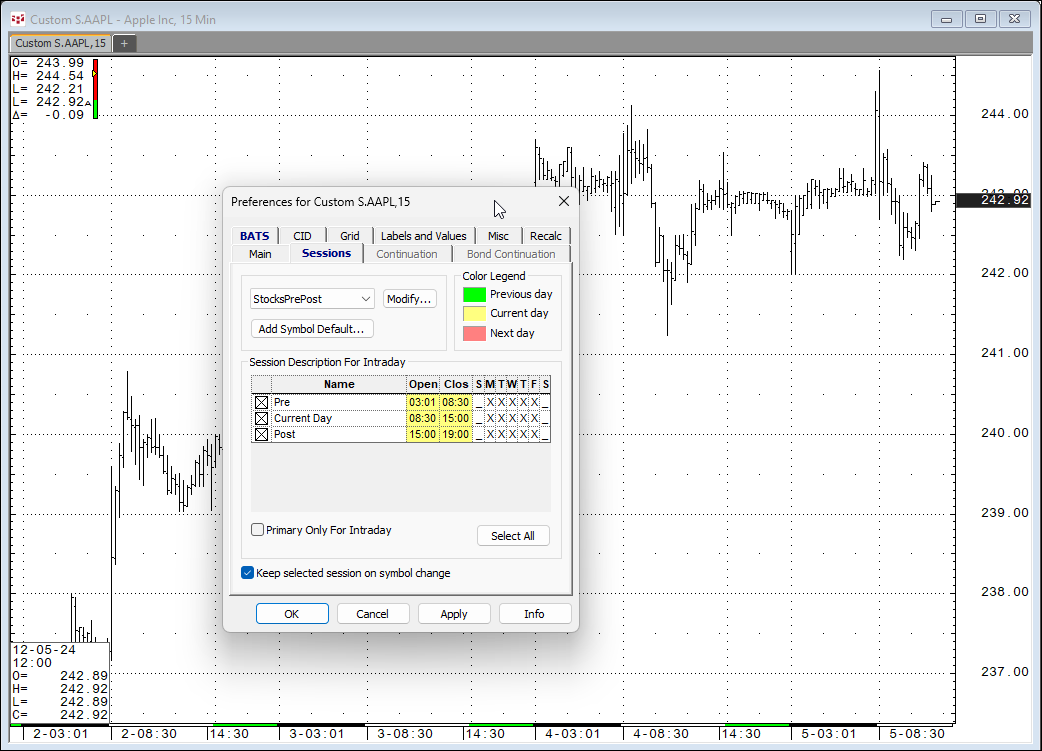
First, download the PAC from the Post: View Pre and Post Sessions for Stocks, which will install the customized session called StocksPrePost shown in the image below.
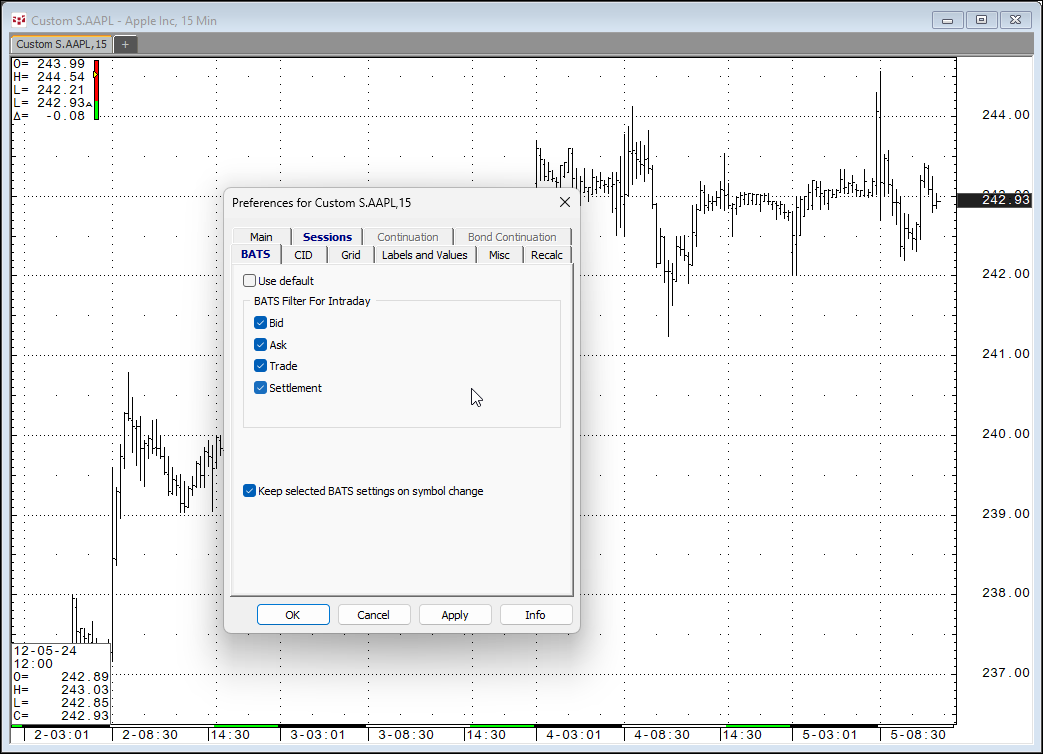
The PAC sets the charts in the page to display Bids, Asks, Trades, and Settlement.
Regarding the downloadable sample Excel file, the custom session name (StocksPrePost) is entered in cell M10 and B,A,TS is entered in cell M12.
Requirements: CQG Integrated Client or QTrader, and Excel 2016 (locally installed, not in the Cloud) or more recent.


