Each Wednesday this article will be updated with the current seasonal study using CQG's Seasonal analysis applied to the Soybean, Wheat and Corn markets. You can download the CQG pac providing the studies and charts here. In addition, the seasonal data lines can be pulled into Excel using RTD formulas.
Below each chart are two tables. The first table is the highest correlation of the current market data to the seasonal year using a 20-day, 50-day, 100-day and the 200-day lookback periods. The second table is the previous week's data. Seasonal analysis is about price direction or the trend.
Soybeans
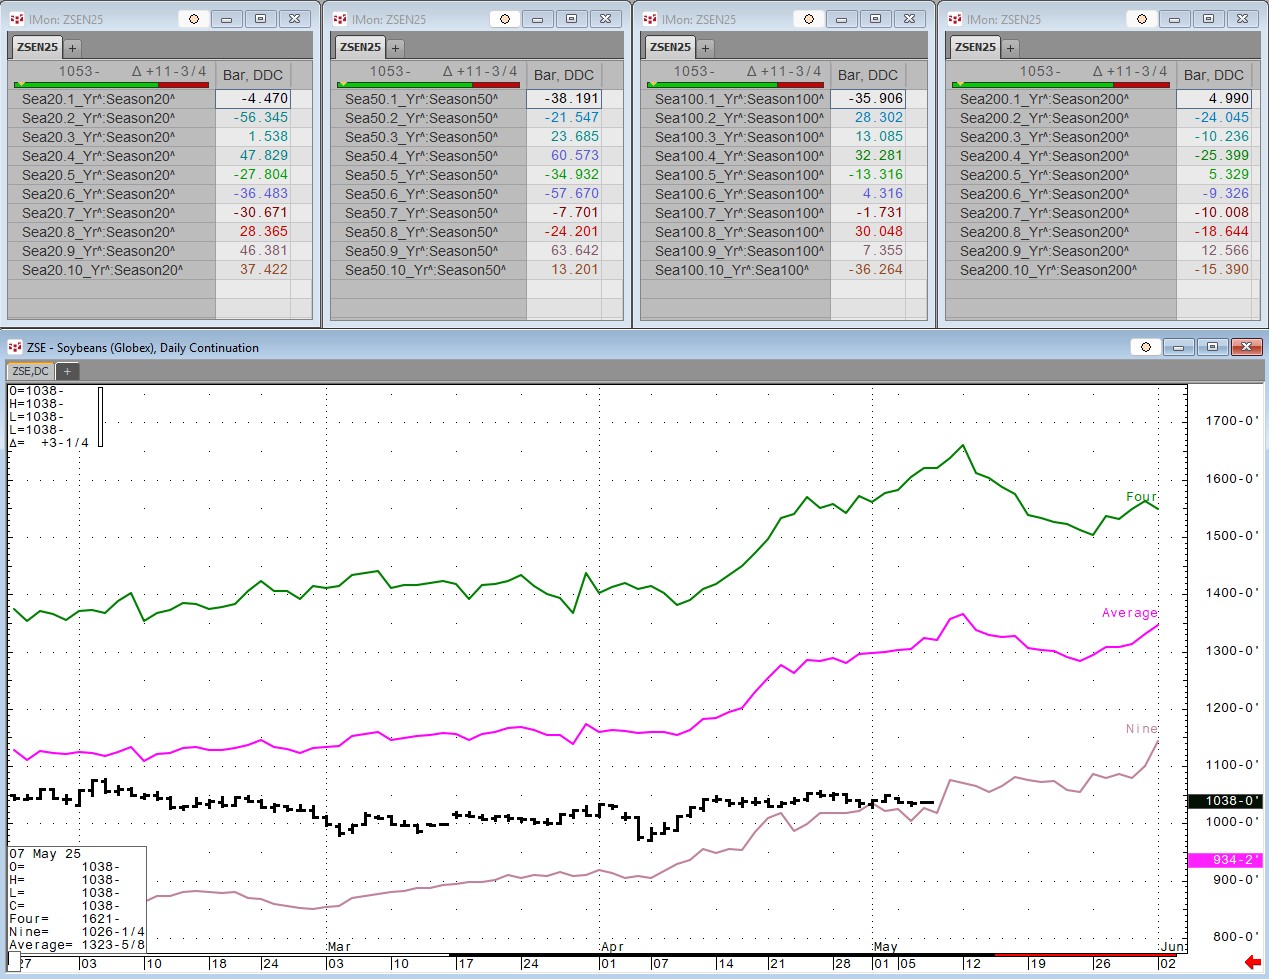
| This Week's Data | ||||
| Correlation Lookback (Days) | 20 | 50 | 100 | 200 |
| Seasonal Year Back with the Highest Correlation | 4_Yr 47.83 | 9_Yr 63.64 | 4_Yr 32.28 | 9_Yr 12.57 |
| Last Week's Data | ||||
| Correlation Lookback (Days) | 20 | 50 | 100 | 200 |
| Seasonal Year Back with the Highest Correlation | 9_Yr 73.30 | 4_Yr 37.32 | 4_Yr 35.99 | 9_Yr 21.23 |
Wheat
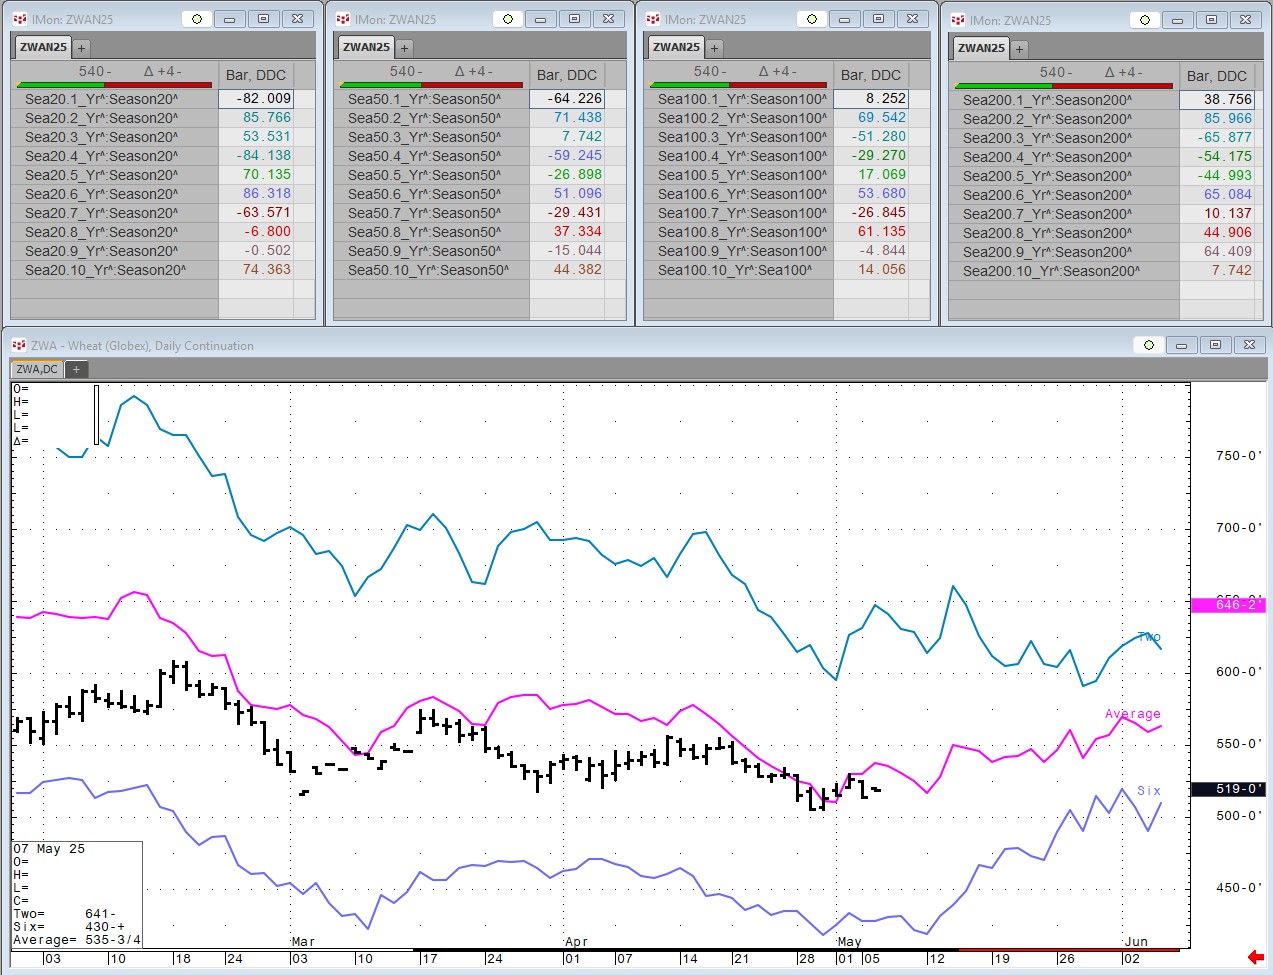
| This Week's Data | ||||
| Correlation Lookback (Days) | 20 | 50 | 100 | 200 |
| Seasonal Year Back with the Highest Correlation | 6_Yr 86.32 | 2_Yr 71.44 | 2_Yr 69.54 | 2_Yr 85.97 |
| Last Week's Data | ||||
| Correlation Lookback (Days) | 20 | 50 | 100 | 200 |
| Seasonal Year Back with the Highest Correlation | 2_Yr 81.54 | 2_Yr 81.31 | 2_Yr 65.34 | 2_Yr 84.57 |
Corn
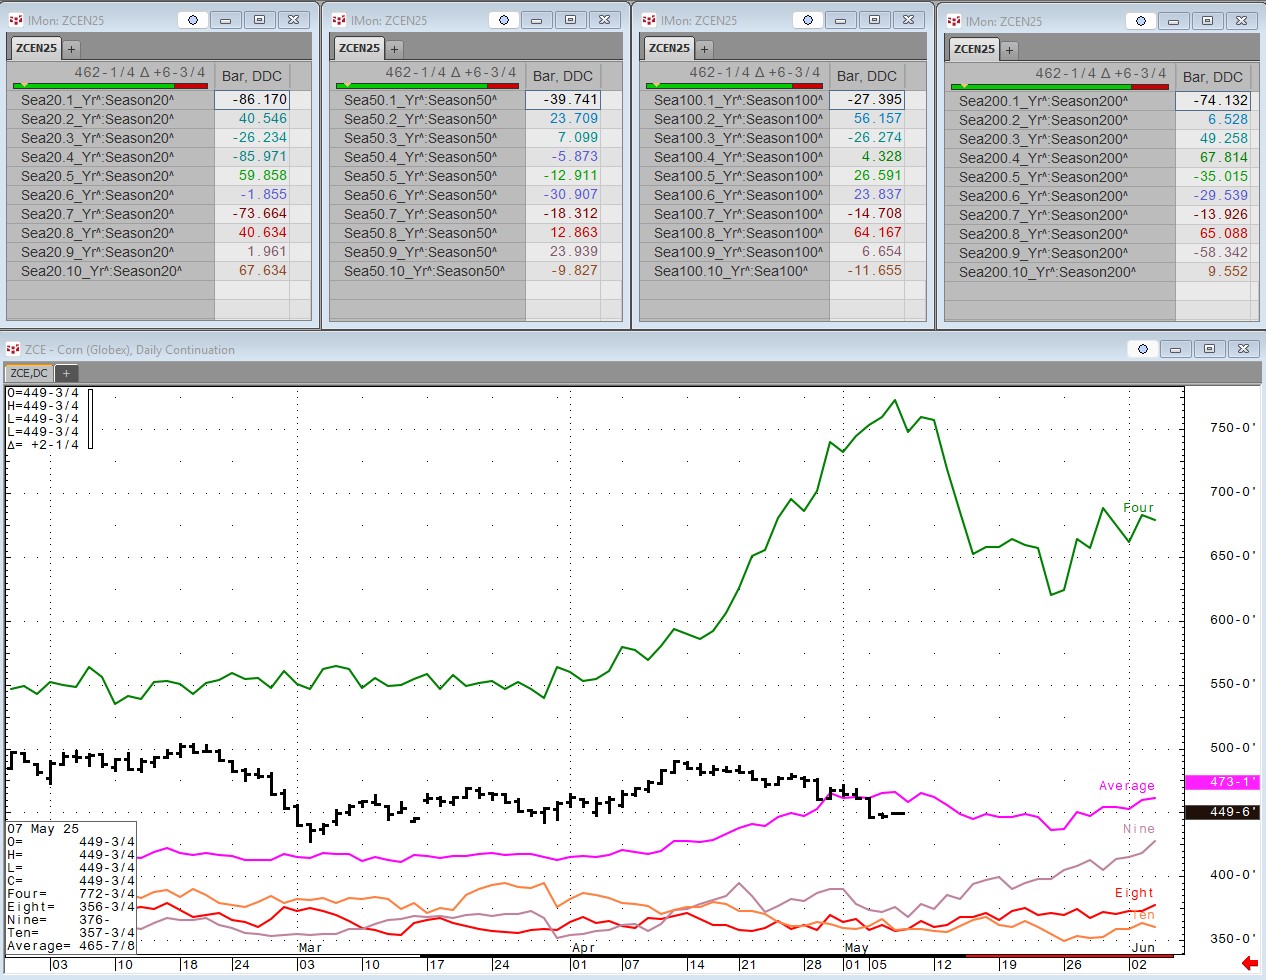
| This Week's Data | ||||
| Correlation Lookback (Days) | 20 | 50 | 100 | 200 |
| Seasonal Year Back with the Highest Correlation | 10_Yr 67.63 | 9_Yr 23.94 | 8_Yr 64.17 | 4_Yr 67.81 |
| Last Week's Data | ||||
| Correlation Lookback (Days) | 20 | 50 | 100 | 200 |
| Seasonal Year Back with the Highest Correlation | 2_Yr 44.28 | 2_Yr 54.26 | 8_Yr 61.06 | 4_Yr 77.54 |