This post offers a downloadable sample Excel spreadsheet for pulling in historical data and study values from CQG IC or QTrader using RTD formulas.
The Data consists of:
- Open, High, Low, and Close.
- Volume
- Moving Average
- Bollinger Bands
- MACD
- RSI
- Stochastics
- Imoku
The Dashboard offers input cells for the study parameters.
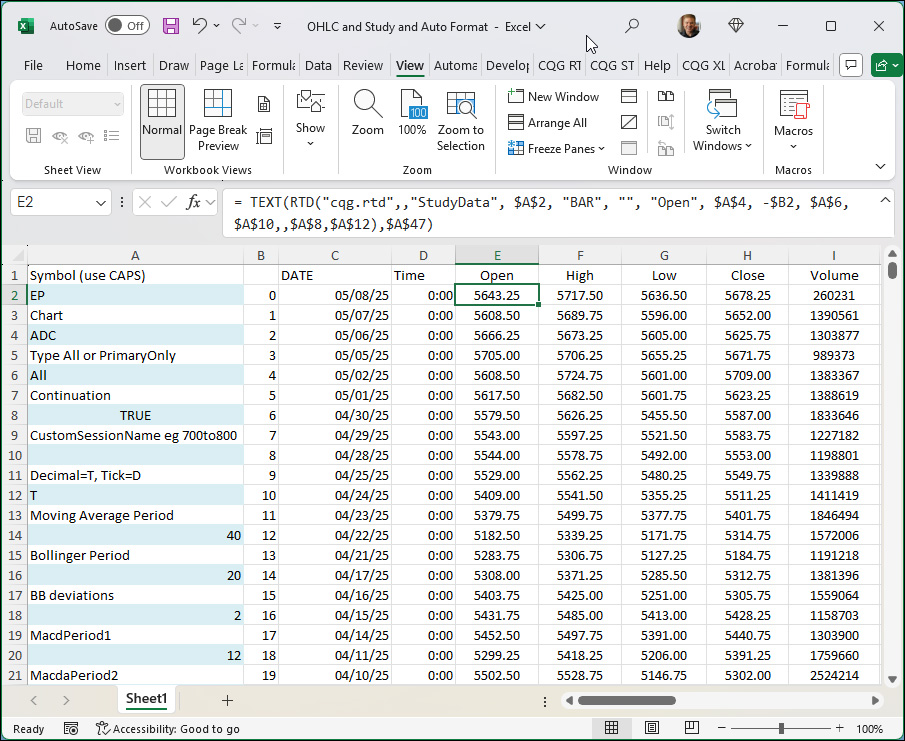
In addition, if the symbol is changed the spreadsheet determines the number of decimals of the tick size and then formats all prices using that number.
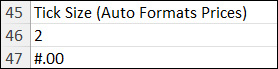
Excel's IFS function is used:
=IFS(A46=0,"#",A46=1,"#.00",A46=2,"#.00",A46=3,"#.000",A46=4,"#.0000",A46=5,"#.00000",A46=6,"#.000000",A46=7,"#.0000000")
The Excel TEXT function is employed for formatting the price using cell $A$47.
=TEXT(RTD("cqg.rtd",,"StudyData", $A$2, "BAR", "", "Open", $A$4, -$B2, $A$6,$A$10,,$A$8,$A$12),$A$47)Requirements: CQG Integrated Client or QTrader, and Excel 2019 (locally installed, not in the Cloud) or more recent.