This post details an Excel dashboard tracking Country Equity ETFs performance. The dashboard ranks and sorts the Country ETFs traded using the NYSE American enablement. Fifty-one ETFs are tracked. The market performance ranked and sorted and is divided into four quartiles. The charts show the performance for the current year (dark blue histogram lines) and the end of 2024 price performance (the light blue histogram lines) using the percentage net change.
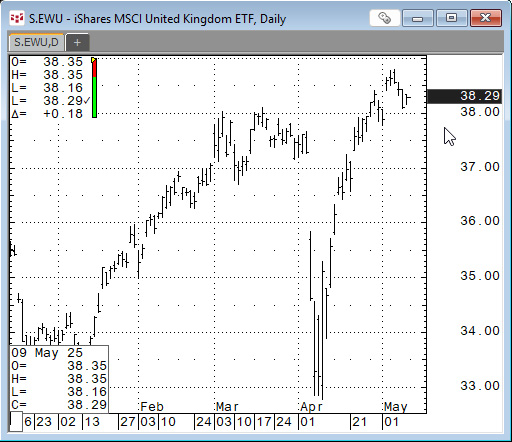
The dashboard may be useful for tracking global market action during the (as of this writing) tariff negotiations. For example, this next chart, the iShares United Kingdom ETF sold off sharply from the announcements of the new tariffs, and when a new agreement was announced, the ETF has rallied to all time new multi-year highs.
Each tab is a quartile based on performance. As stated, the dark blue histogram bars are this year's annual percentage net change. The end point labels provide with the current percentage net change, the highest percentage net change and the lowest percentage net change.
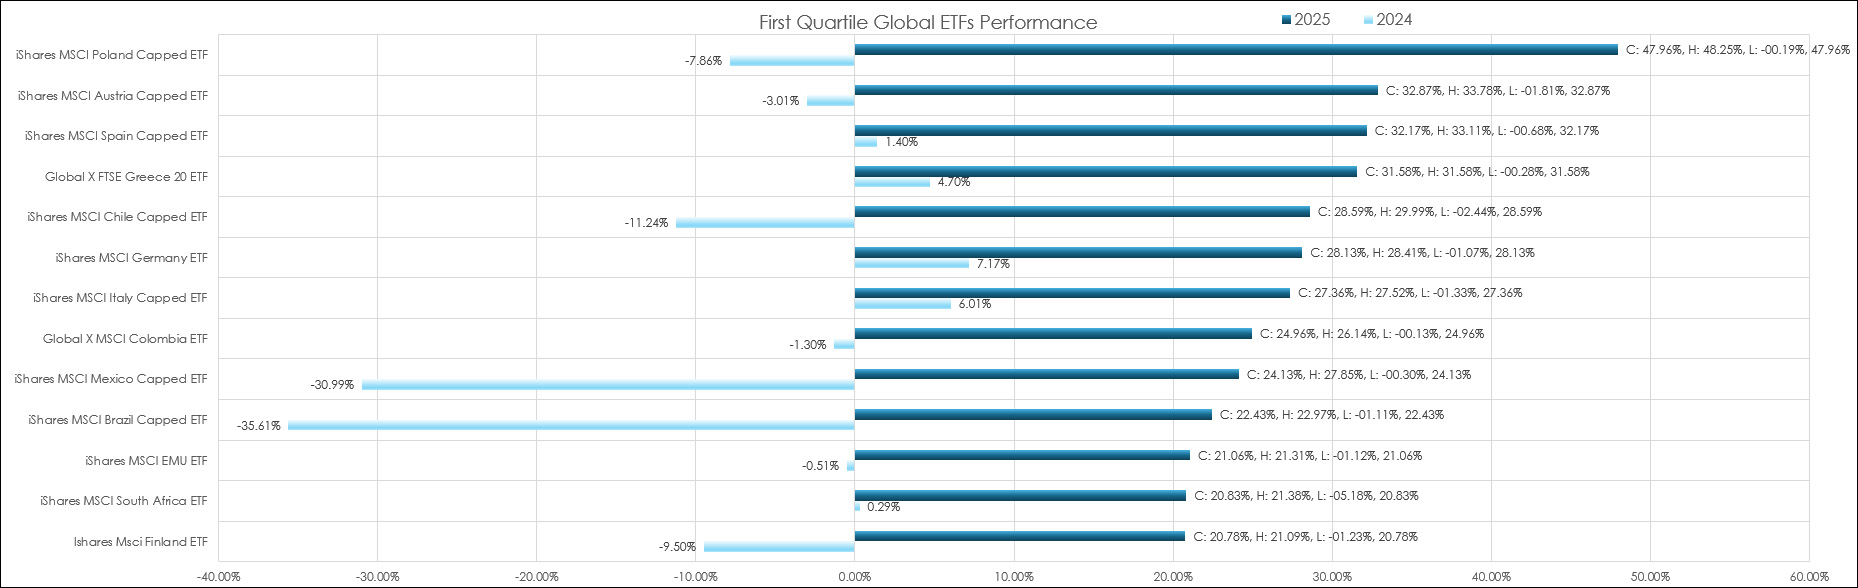
Above, the top performer is the iShares MSCI Poland Capped ETF with C: 47.96%, H: 48.25%, L: -00.19%.
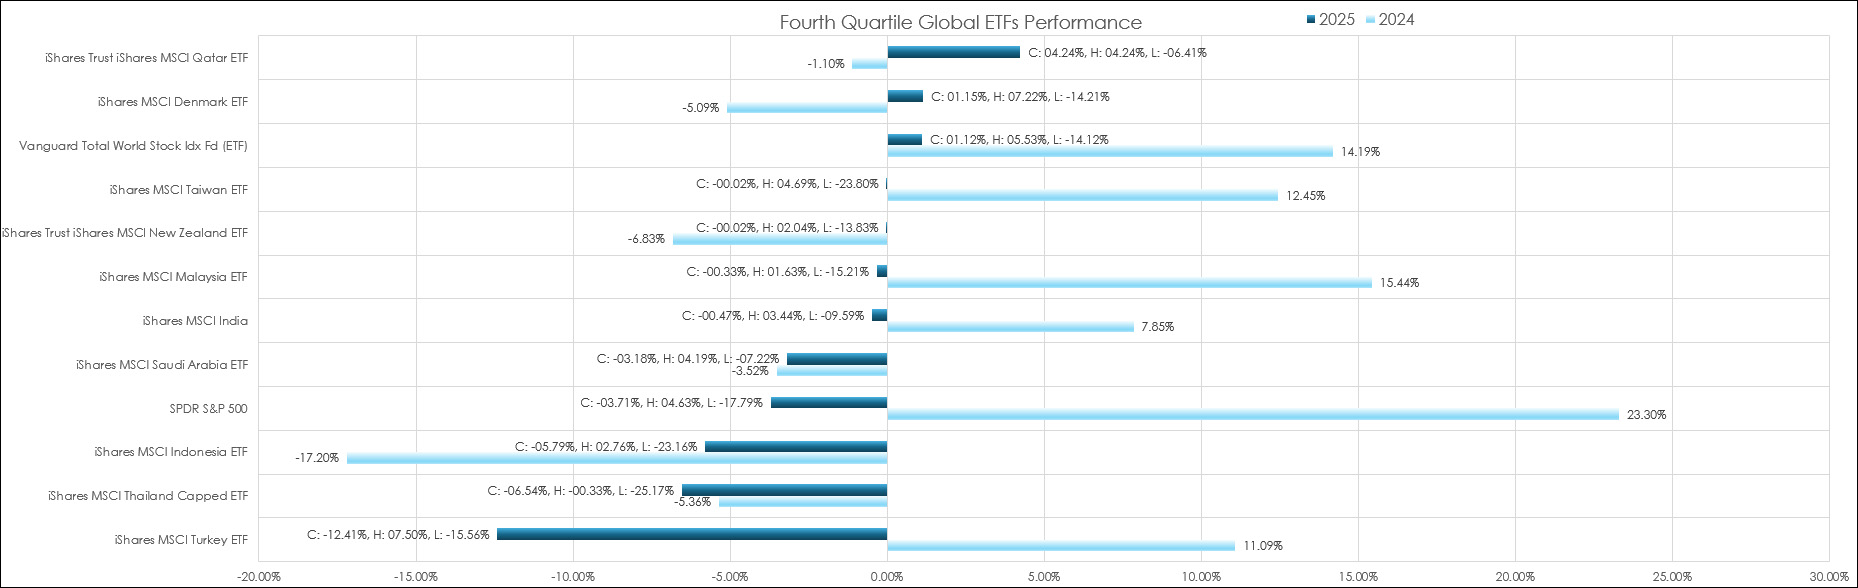
Above, from the fourth quartile tab, the SPDR S&P 500 ETF is C: -03.71%, H: 04.63%, L: -17.79%.
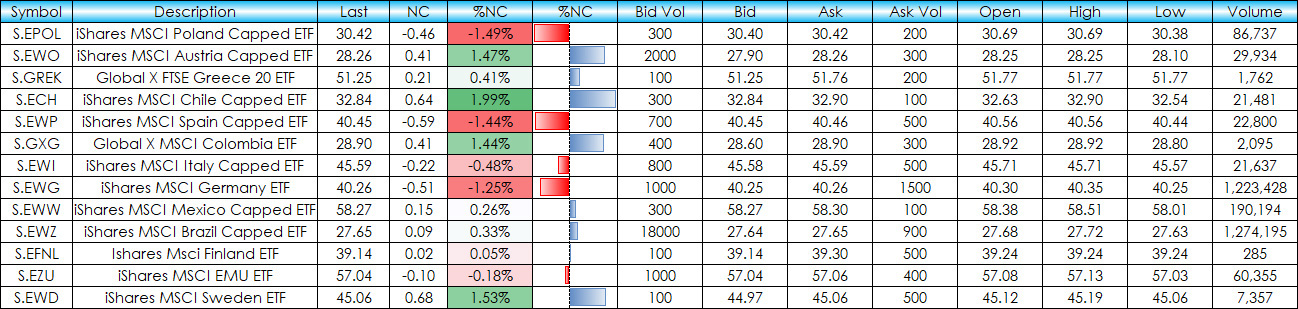
Each tab displays the current session quote display of the ETFs detailed in the chart.
The downloadable sample is not locked.
Requirements: CQG Integrated Client or QTrader, The NYSE American enablement, and Excel 2016 (locally installed, not in the Cloud) or more recent.