Introduction
Cboe Europe Derivatives (CEDX) is a European derivatives marketplace which enables participants to access equity derivatives markets for quotes and trade execution.
CEDX offers a… more
Cboe Europe Derivatives (CEDX) is a European derivatives marketplace which enables participants to access equity derivatives markets for quotes and trade execution.
CEDX offers a… more
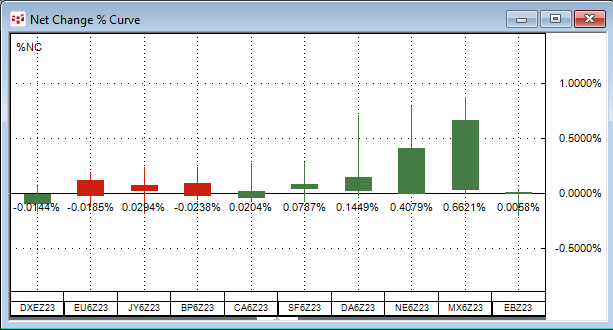
The Net Change Curve chart displays a collection of symbols’ daily net price change or daily net percentage change making it easy to compare on a relative basis each market’s current session’s… more
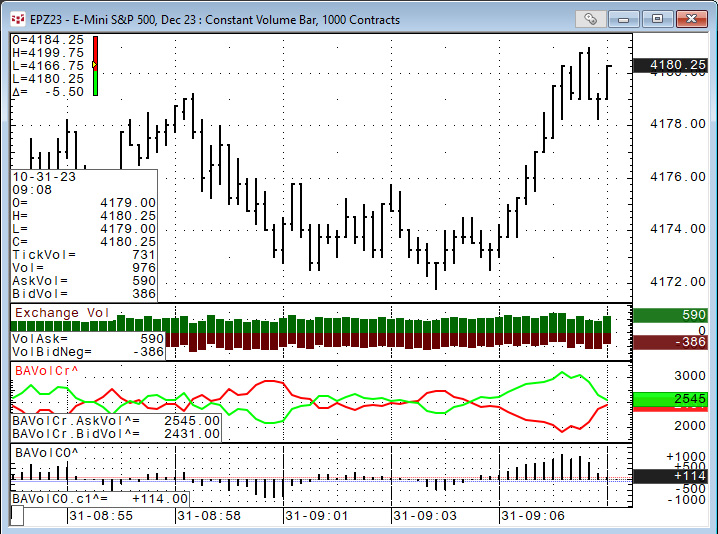
CQG IC and QTrader offer charts that utilize volume for the horizontal scale, not time. The first chart type to discuss is Constant Volume Bars.
Constant Volume Bar (CVB)
The Constant… more
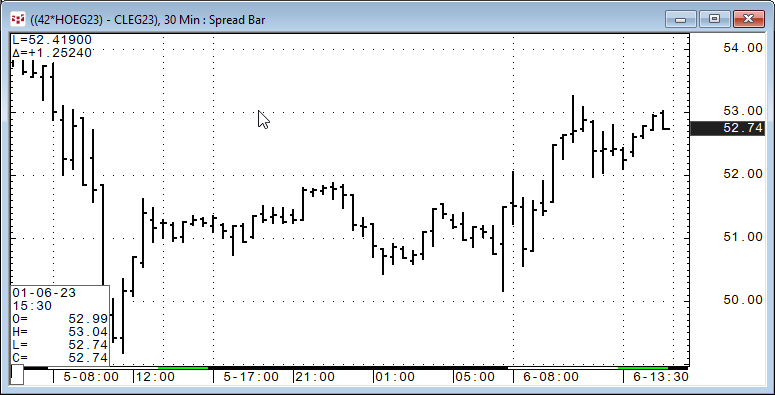
The Spread Bar chart displays spread bar values based on a user set parameter for snap shots at certain intervals.
This is a superior method to simply plotting the spread prices. For… more
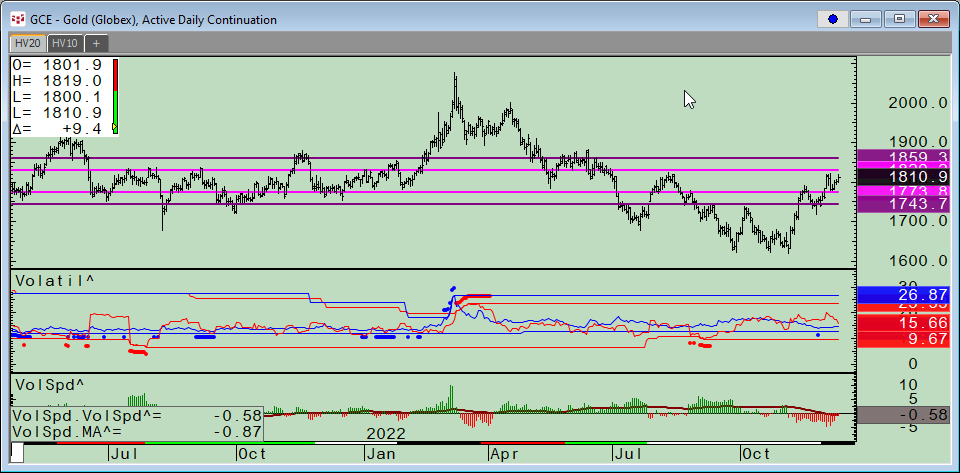
CQG Product Specialist Stan Yabroff designed a CQG page for customers to track and analyze a market’s implied volatility and historical volatility. This post details the features and functionality… more
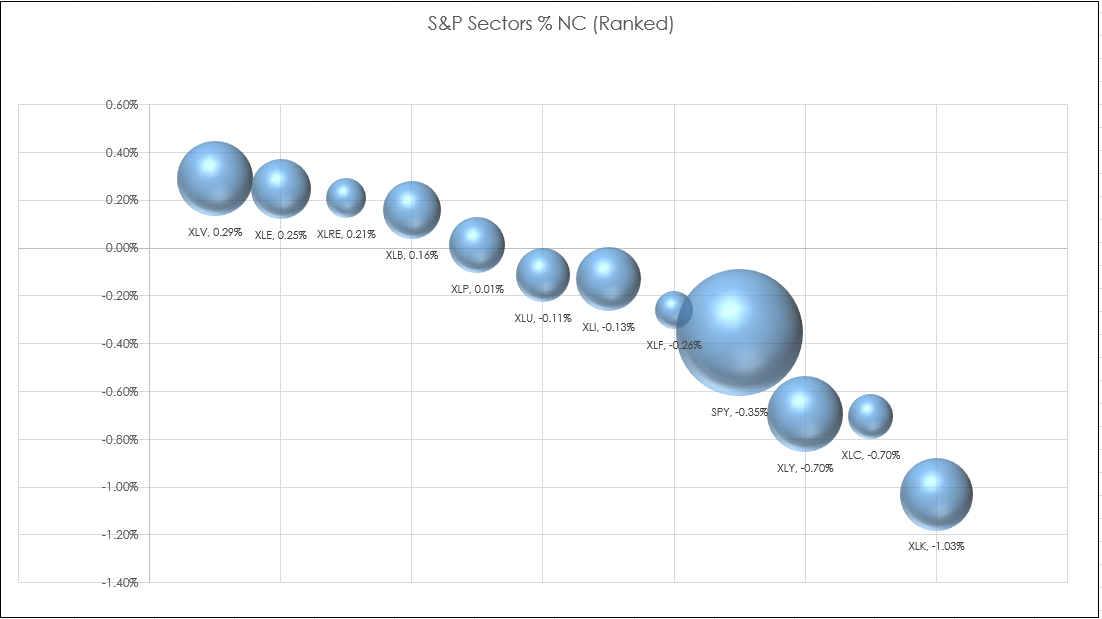
The Microsoft® Excel 3-D chart is different from the Excel Scatter Plot chart. The Scatter chart uses a fixed size for the chart data points. The 3-D chart accesses an additional column to set the… more
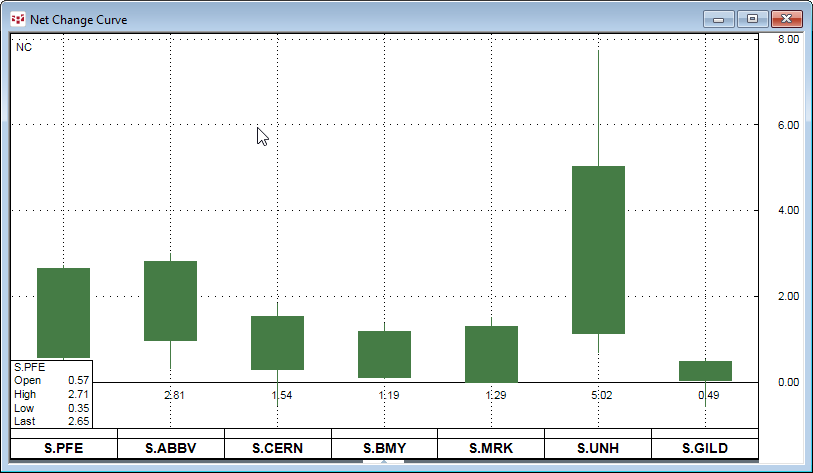
CQG Version 22.12.8002 introduces CQG’s Net Change Curve Chart.
This chart type enables you to compare the current session’s performance of a collection of markets. The above image… more