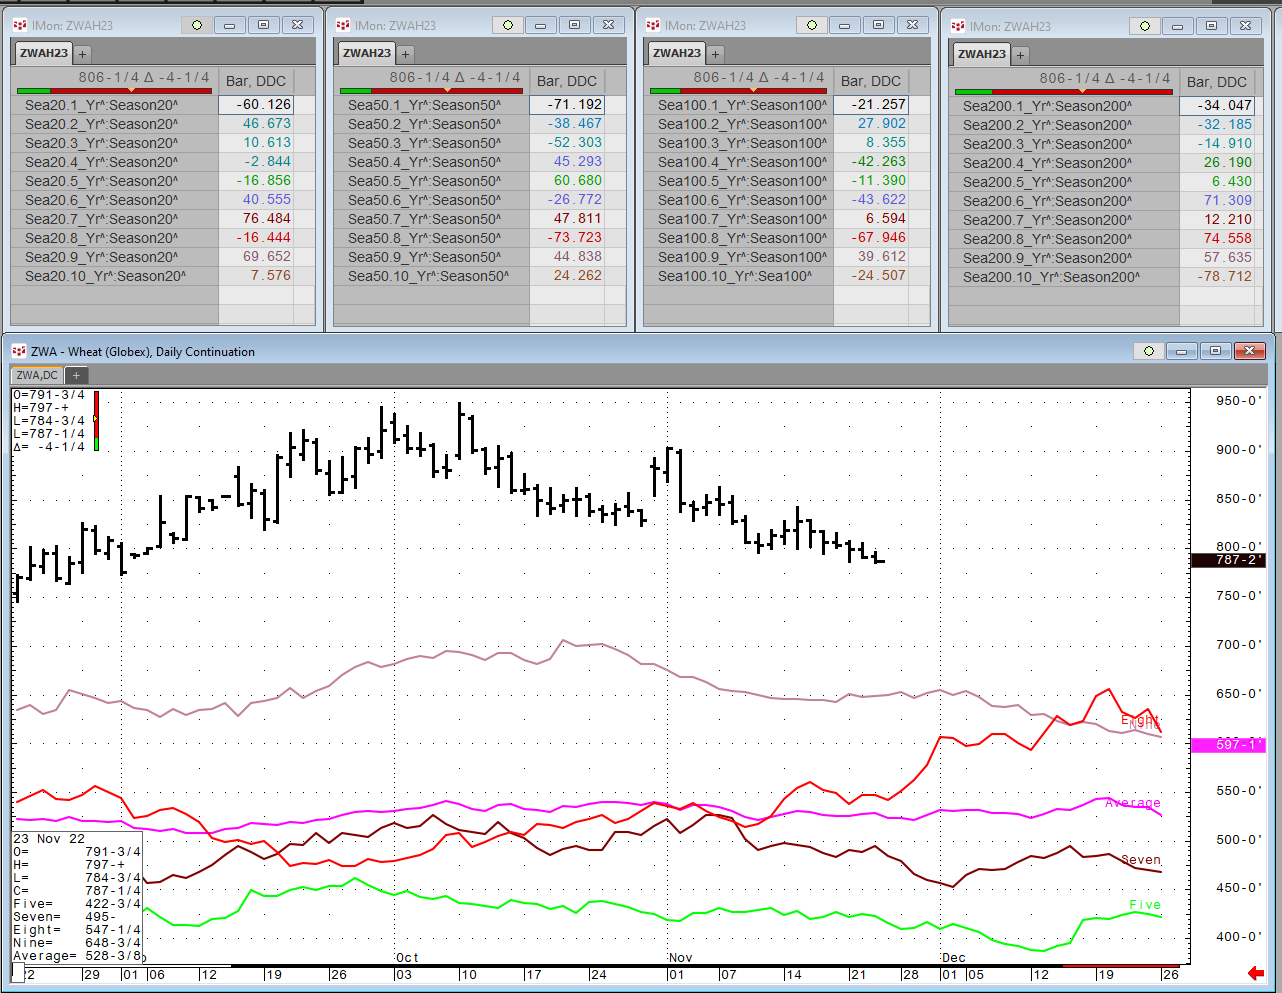
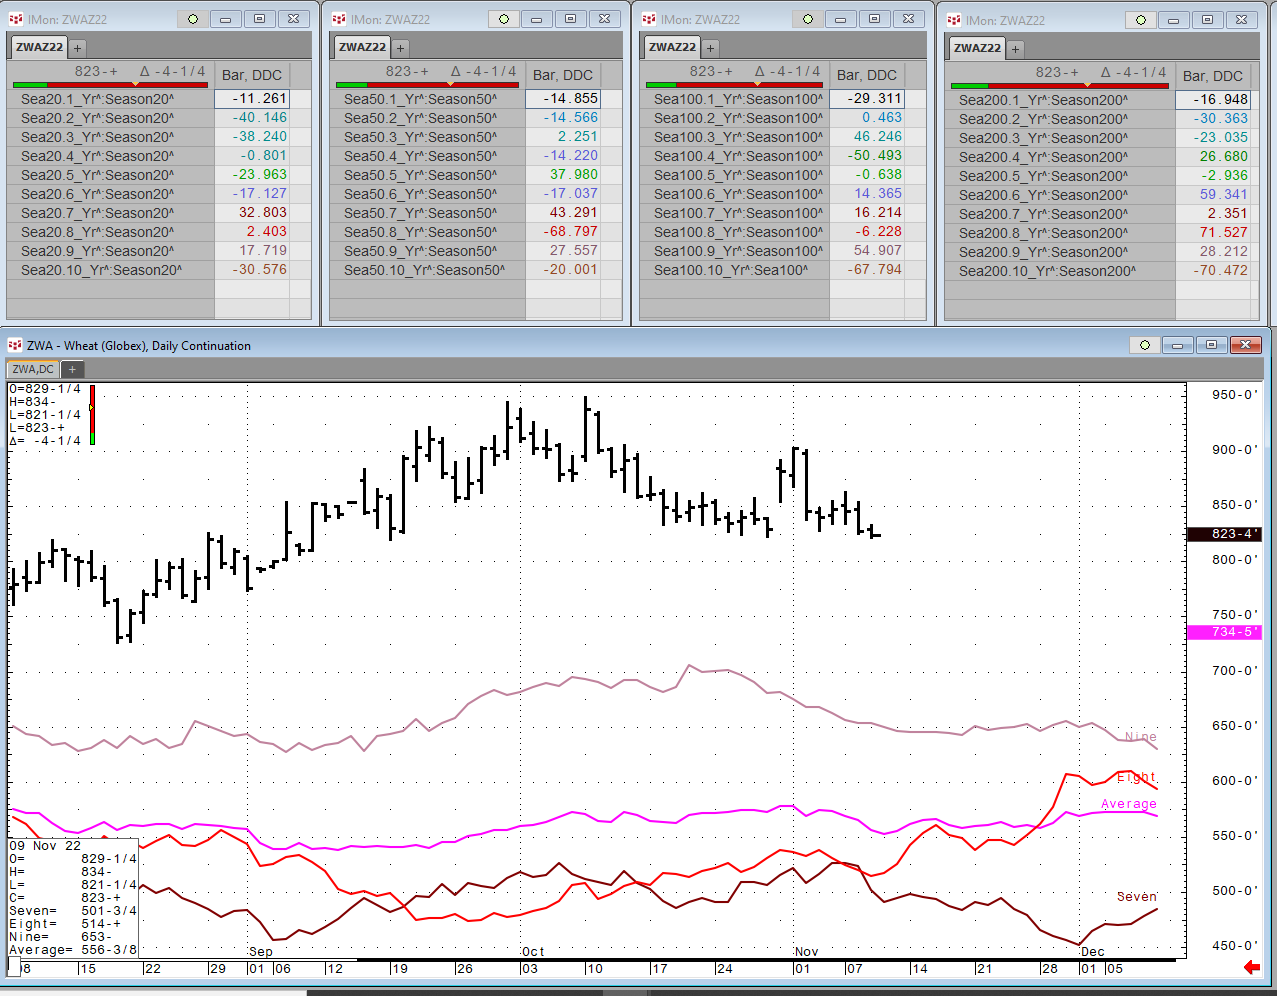
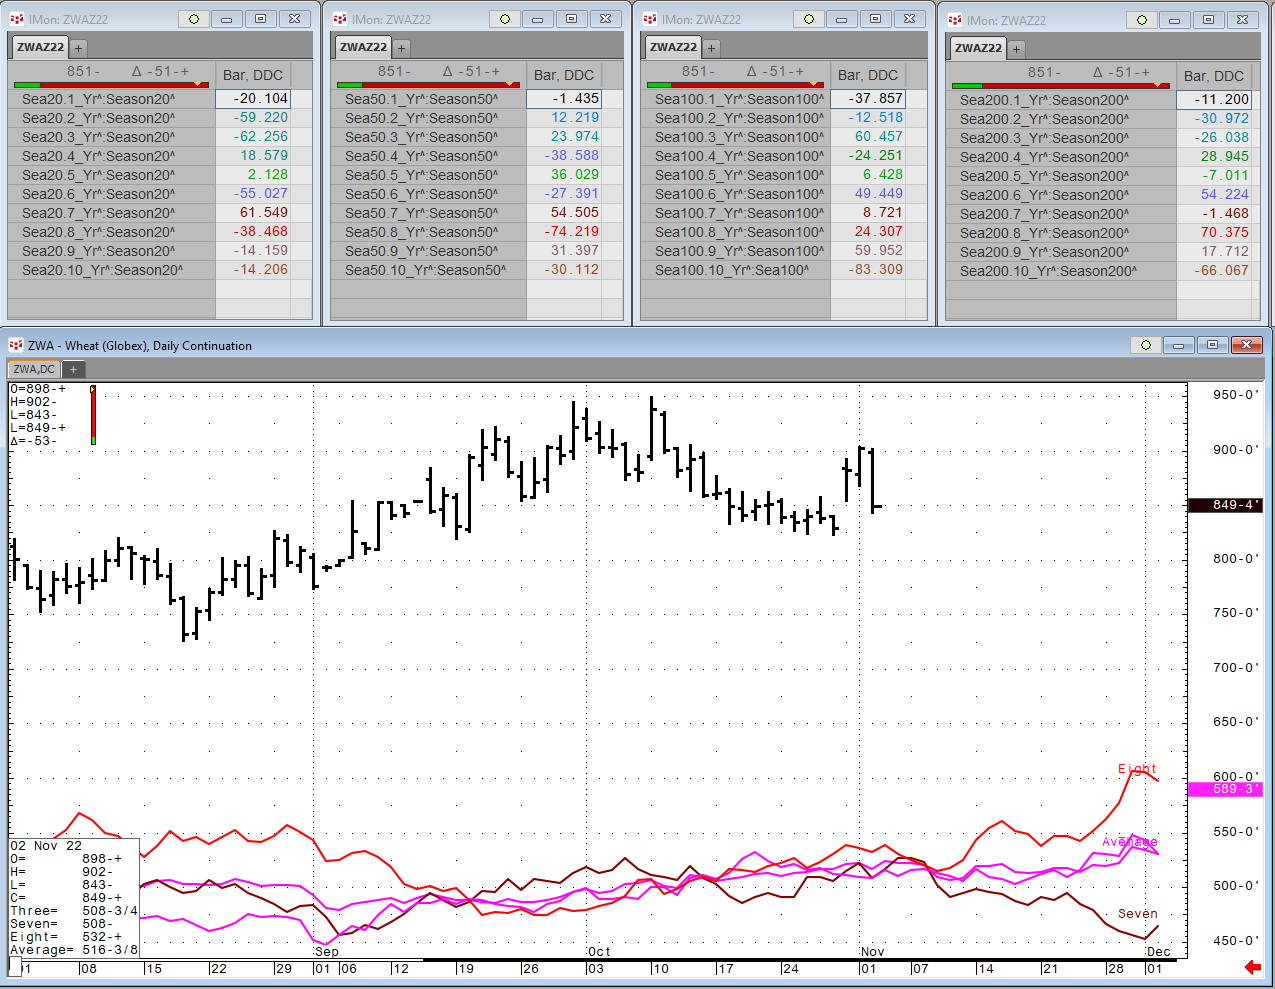
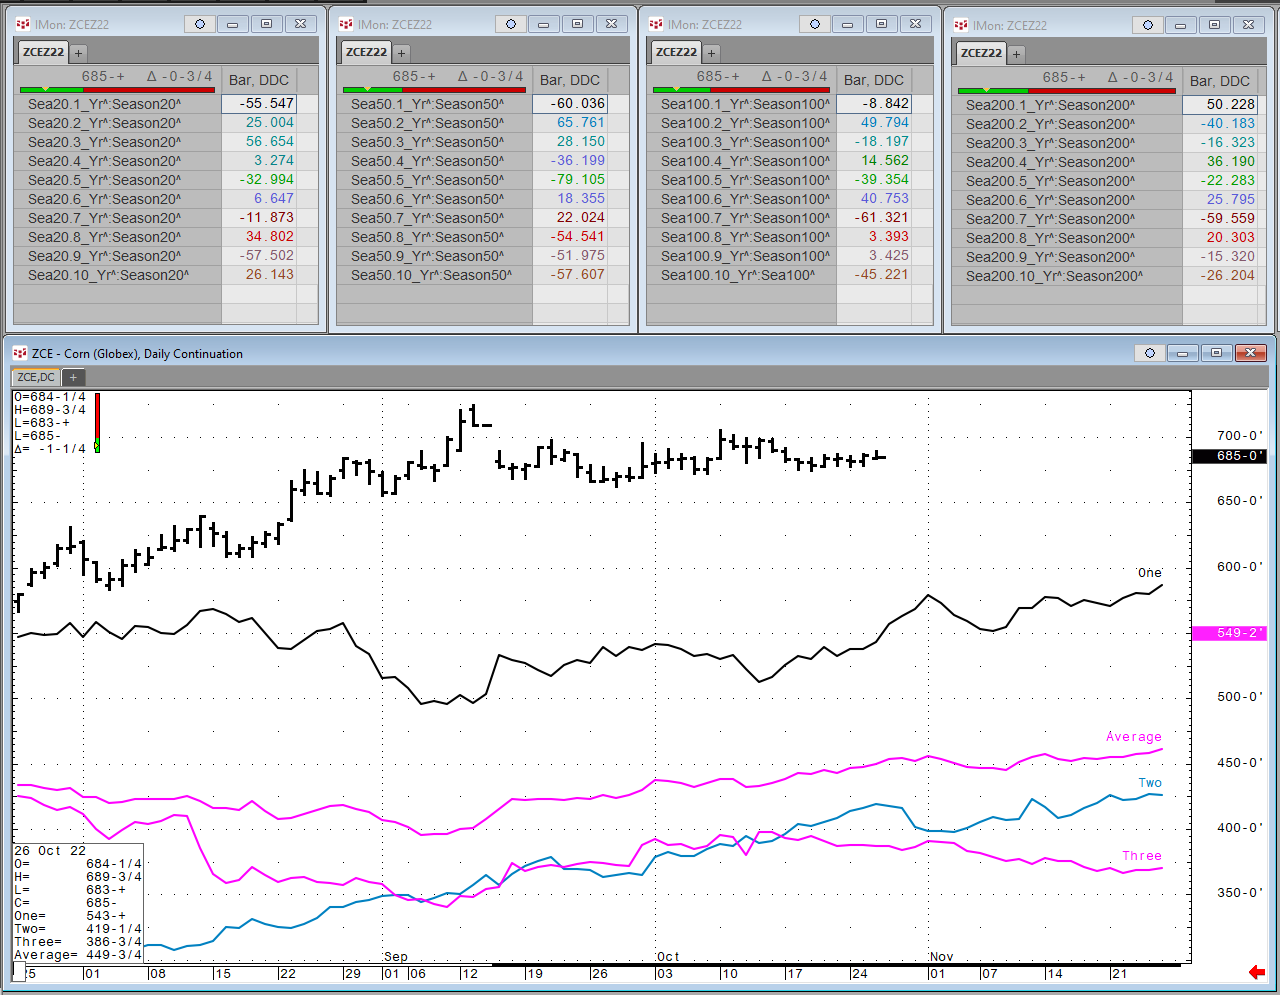
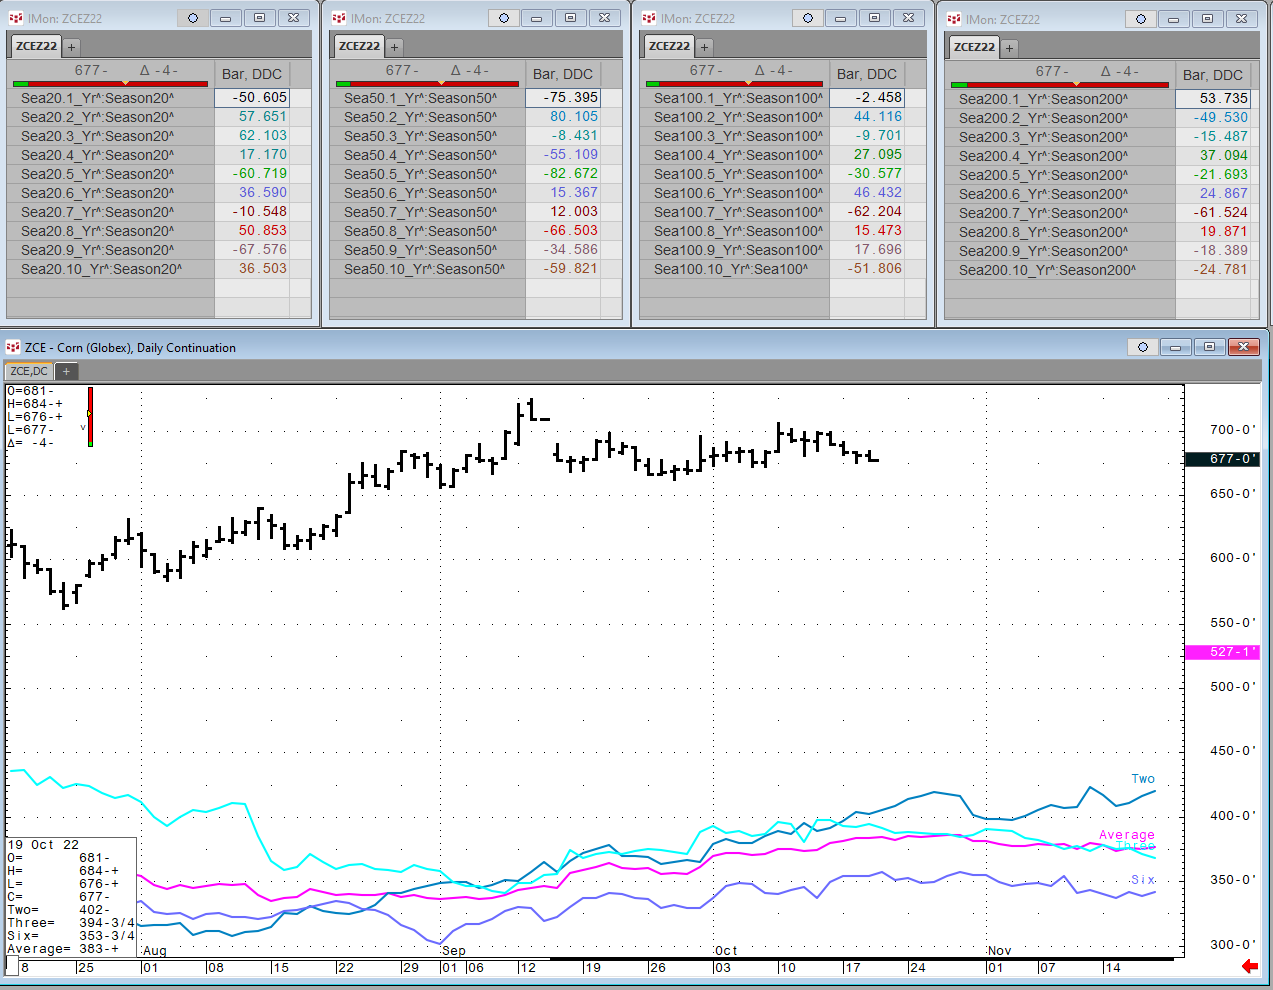
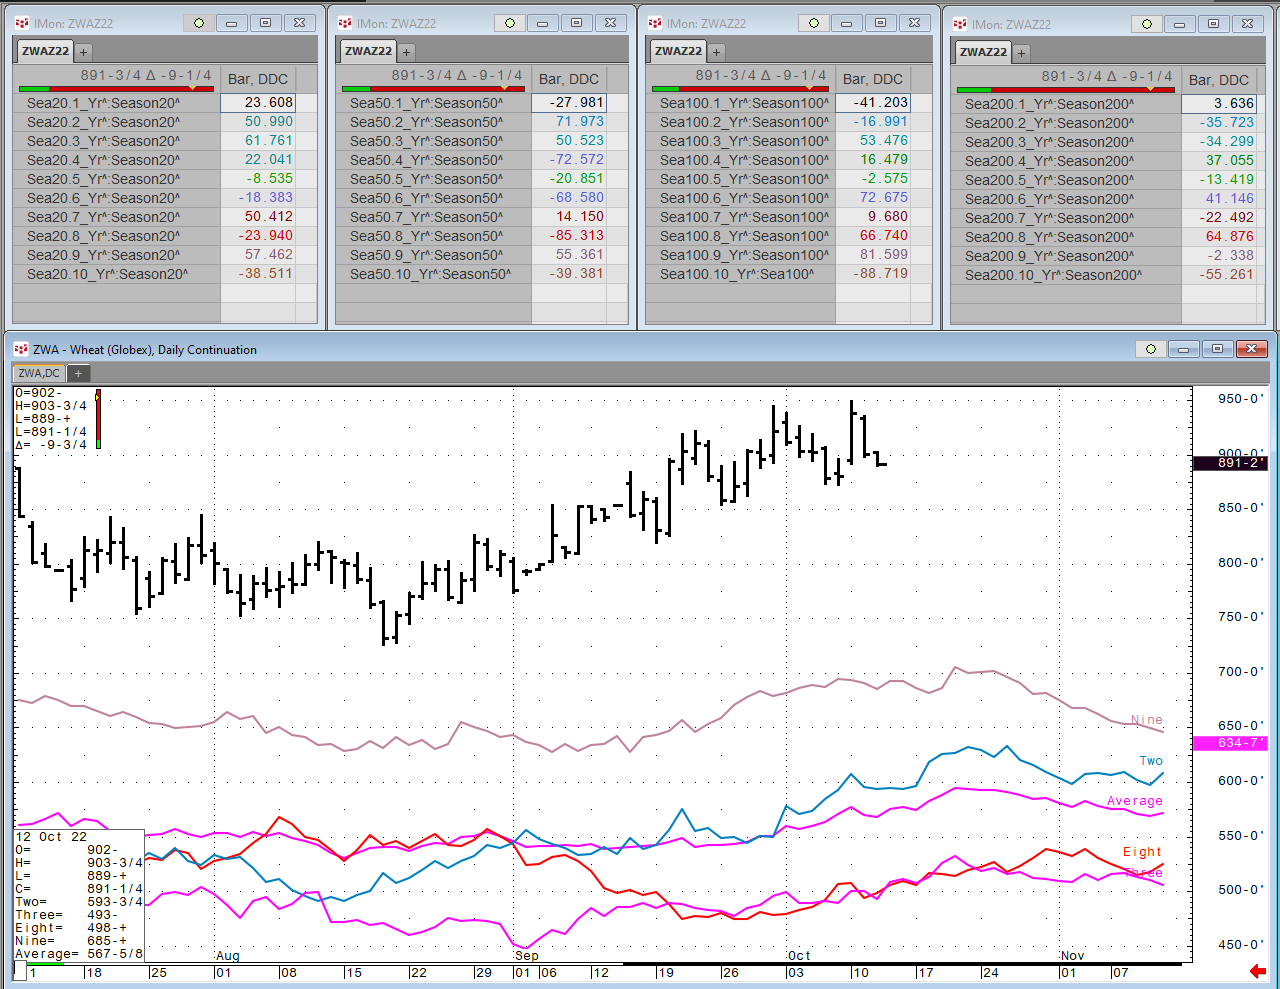
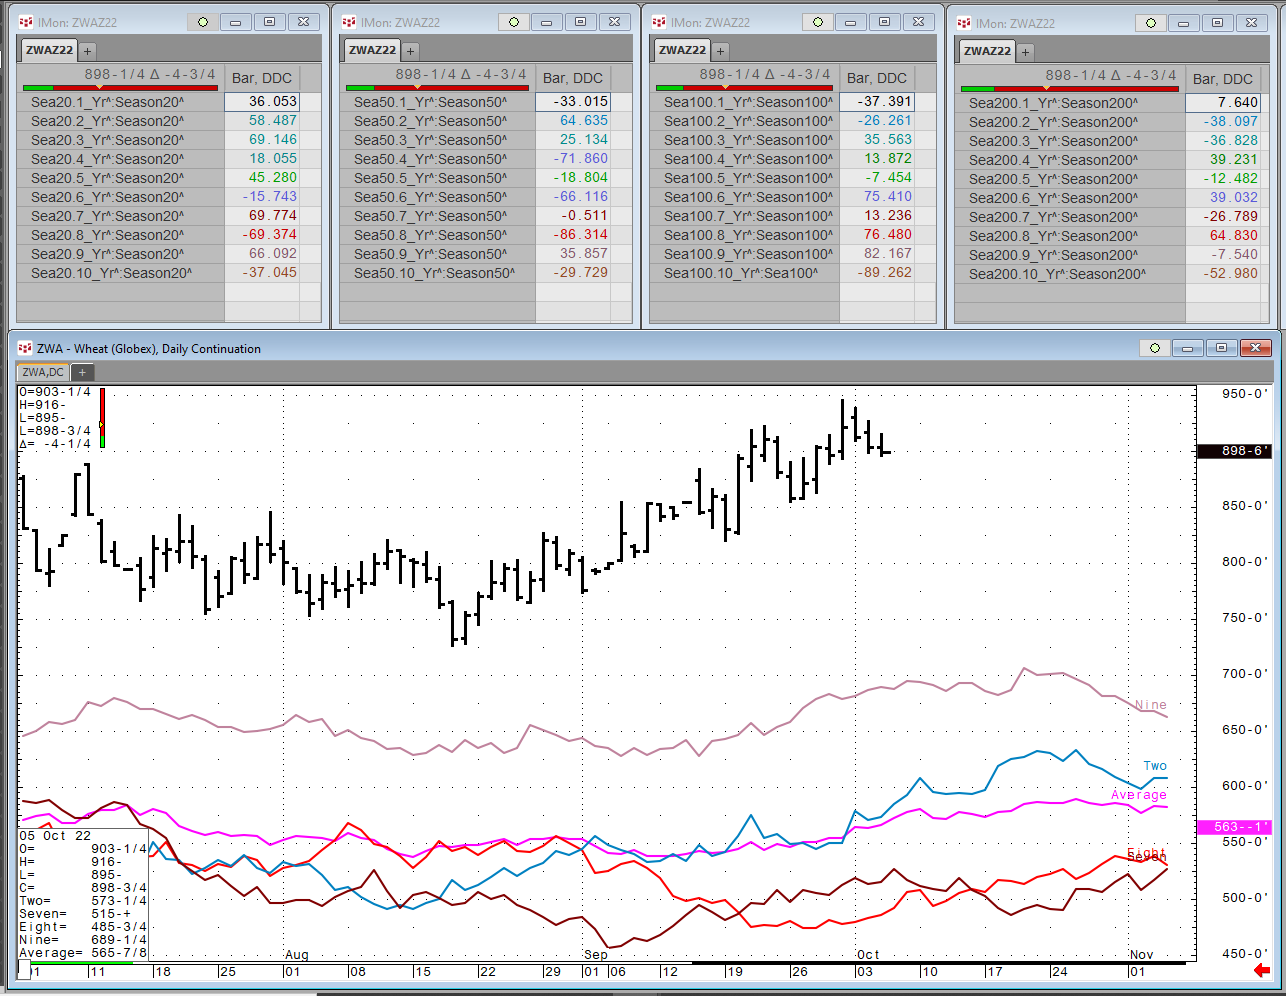
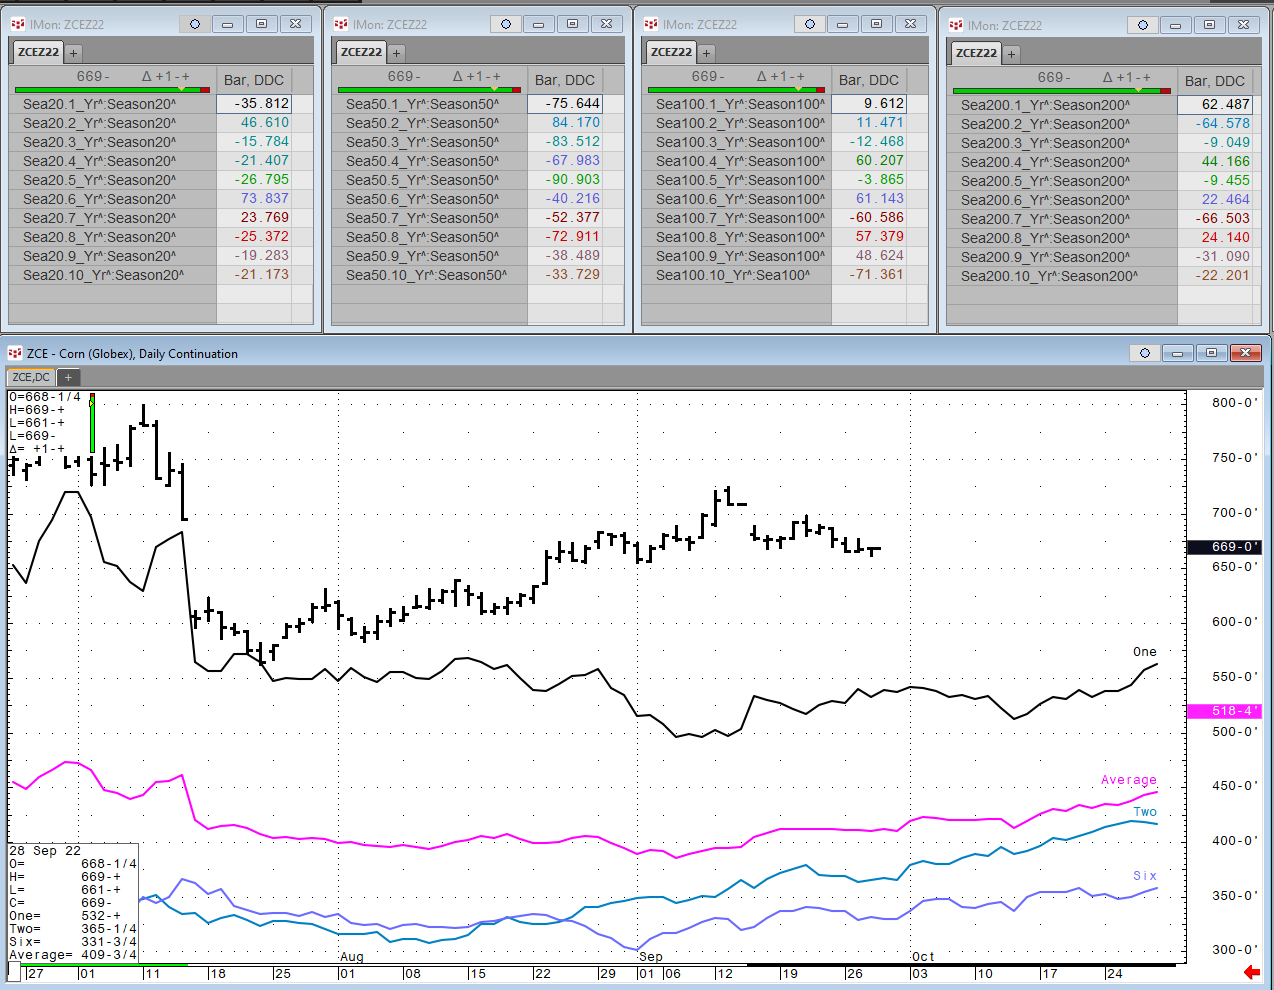
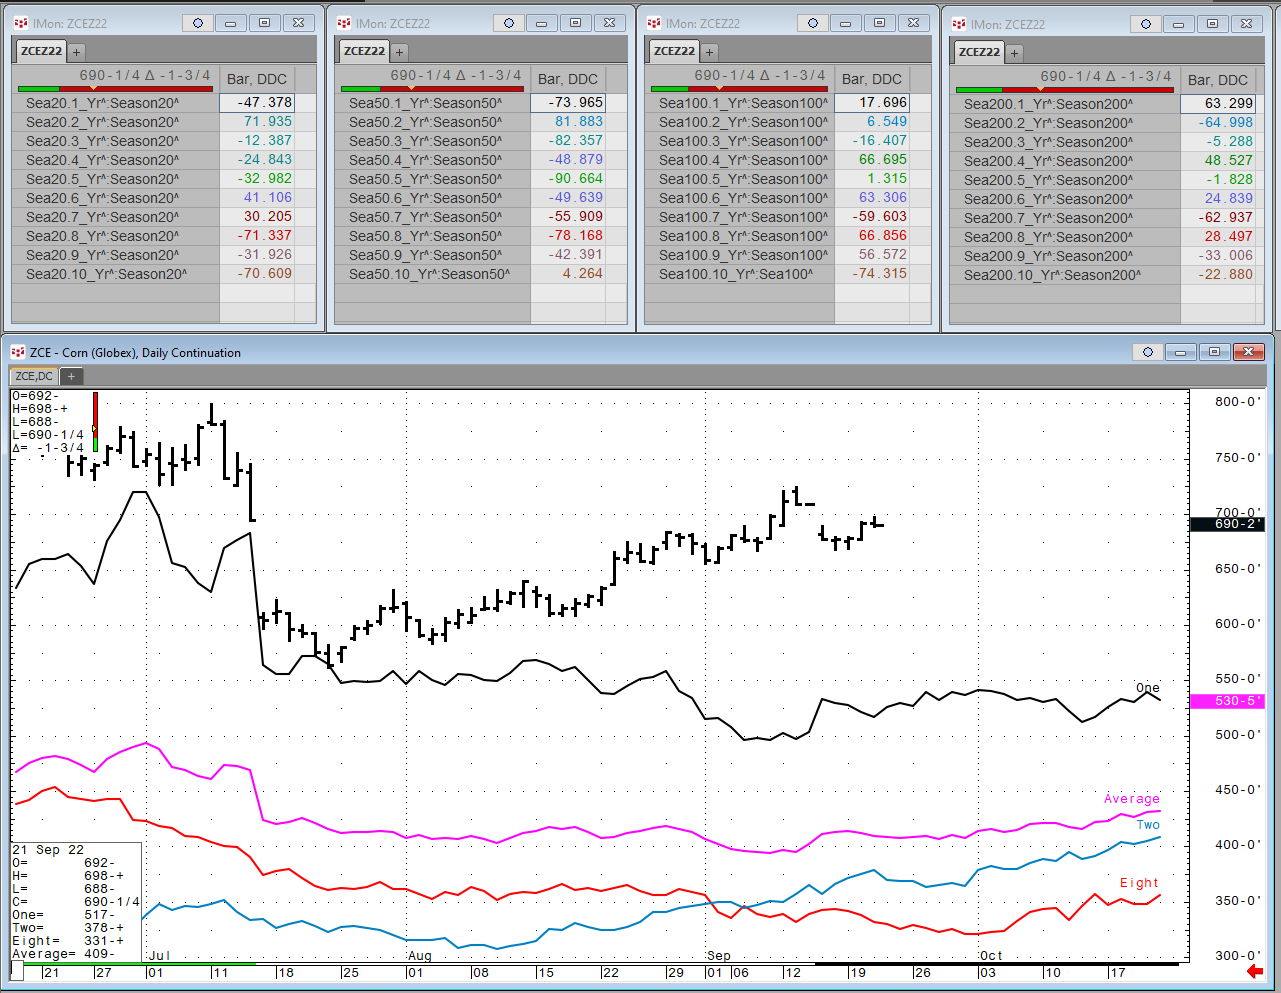
Each Wednesday this article will be updated with the current seasonal study using CQG’s Seasonal analysis applied to the Soybean, Wheat and Corn markets. You can download the CQG pac providing the… more
Grains

Each Wednesday this article will be updated with the current seasonal study using CQG’s Seasonal analysis applied to the Soybean, Wheat and Corn markets. You can download the CQG pac providing the… more
Each Wednesday this article will be updated with the current seasonal study using CQG’s Seasonal analysis applied to the Soybean, Wheat and Corn markets. You can download the CQG pac providing the… more
Each Wednesday this article will be updated with the current seasonal study using CQG’s Seasonal analysis applied to the Soybean, Wheat and Corn markets. You can download the CQG pac providing the… more
Each Wednesday this article will be updated with the current seasonal study using CQG’s Seasonal analysis applied to the Soybean, Wheat and Corn markets. You can download the CQG pac providing the… more
Each Wednesday this article will be updated with the current seasonal study using CQG’s Seasonal analysis applied to the Soybean, Wheat and Corn markets. You can download the CQG pac providing the… more
Each Wednesday this article will be updated with the current seasonal study using CQG’s Seasonal analysis applied to the Soybean, Wheat and Corn markets. You can download the CQG pac providing the… more
Each Wednesday this article will be updated with the current seasonal study using CQG’s Seasonal analysis applied to the Soybean, Wheat and Corn markets. You can download the CQG pac providing the… more
Each Wednesday this article will be updated with the current seasonal study using CQG’s Seasonal analysis applied to the Soybean, Wheat and Corn markets. You can download the CQG pac providing the… more
Each Wednesday this article will be updated with the current seasonal study using CQG’s Seasonal analysis applied to the Soybean, Wheat and Corn markets. You can download the CQG pac providing the… more