Whilst there a multitude of ways of analyzing markets the Fourth Dimension has one core philosophy that makes it unique. Namely, the creation of multiple timeframe analysis on one chart and the creation of a suite of studies and code concentrating on Time analysis and therefore timing.
The idea came to me originally by seeing how difficult it was for me and professional traders to keep track of all the relevant markets and have a firm grip of what was the true picture, in terms of different timeframes and different levels of both momentum and support and resistance. Ask any trader what some of the most important things to them are and they will say things like controlling risk, not missing the opportunity, and managing the position. On a crowded desk, filled with screens and information, often the poor old chart is stuck in just one or two windows. The problem is screen real estate.
I had already created many studies that looked at multiple timeframe visualization and some of these are covered in my first book "Trading Time, New Methods in Technical Analysis" published in 2007. What I hadn't done is create a coherent uniformed structure that would suit any trader giving them the power to decide what their timing timeframe was and be able to see the bigger picture at the same time. Time and Timing are one of the core building blocks to success, because without it, you can have the best ideas in the world and still lose money.
The first step was to establish true measurements of support and resistance. Most people's analysis will simply focus on recent high or low points and move back in time for what they believe to be significant highs and lows historically. What they haven't done is create a method for quantifying which ones are truly important. My studies Peak Range and Peak Volume qualify what are.
Peak Range begins by measuring the range of any 5-bar sequence in which the middle bar is the highest or lowest point. These are referred to as Swing Points or Fractals in market terms. It then compares that range to a moving average of range over the previous 1000 bars that each swing point created. If the current Swing Range is greater than 30% above the average of the previous swings, it deems the current one to be important and moves the Peak Expansion line to that point. It remains there until the next time the range is greater than 30% of the average.
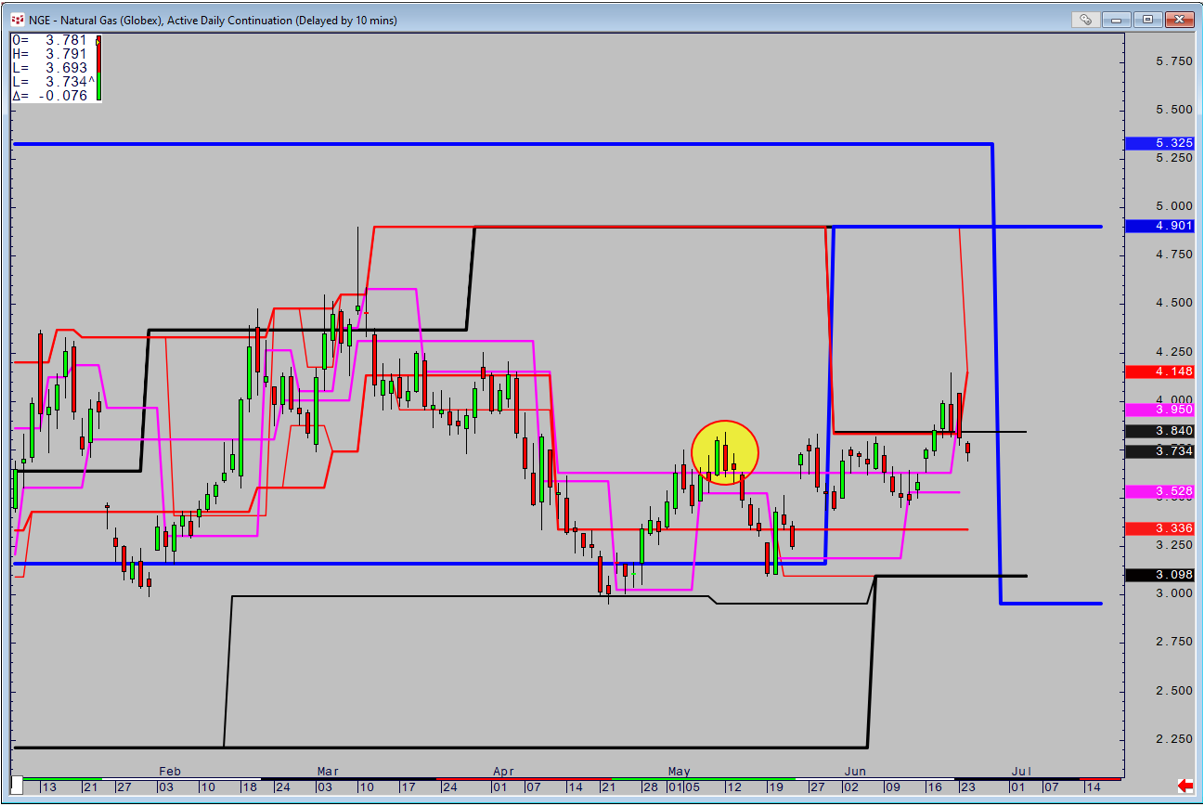
The higher the timeframe the important the level, so historically on Futures the timing timeframe is set at an Equalized Active Daily Continuation, and the Peak Range produces Daily support and resistance lines (Red). Daily Heiken Ashi Lines (Pink), Weekly (black lines) and Monthly (blue lines). This creates a multiple timeframe picture of where the important levels are. Peak Volume does the same calculation but uses volume in instead of range, with the levels changing less frequently than Peak Range.
The importance of using Equalized Active Continuations cannot be overestimated. At each rollover the supports and resistances adjust by the vertical gap created by the rollover and means that the supports and resistances remain dynamic.
The below example is on Nat Gas which has monthly rollovers and so changes the most. On a normal Active Continuation without equalization the area circled appears to have little significance.
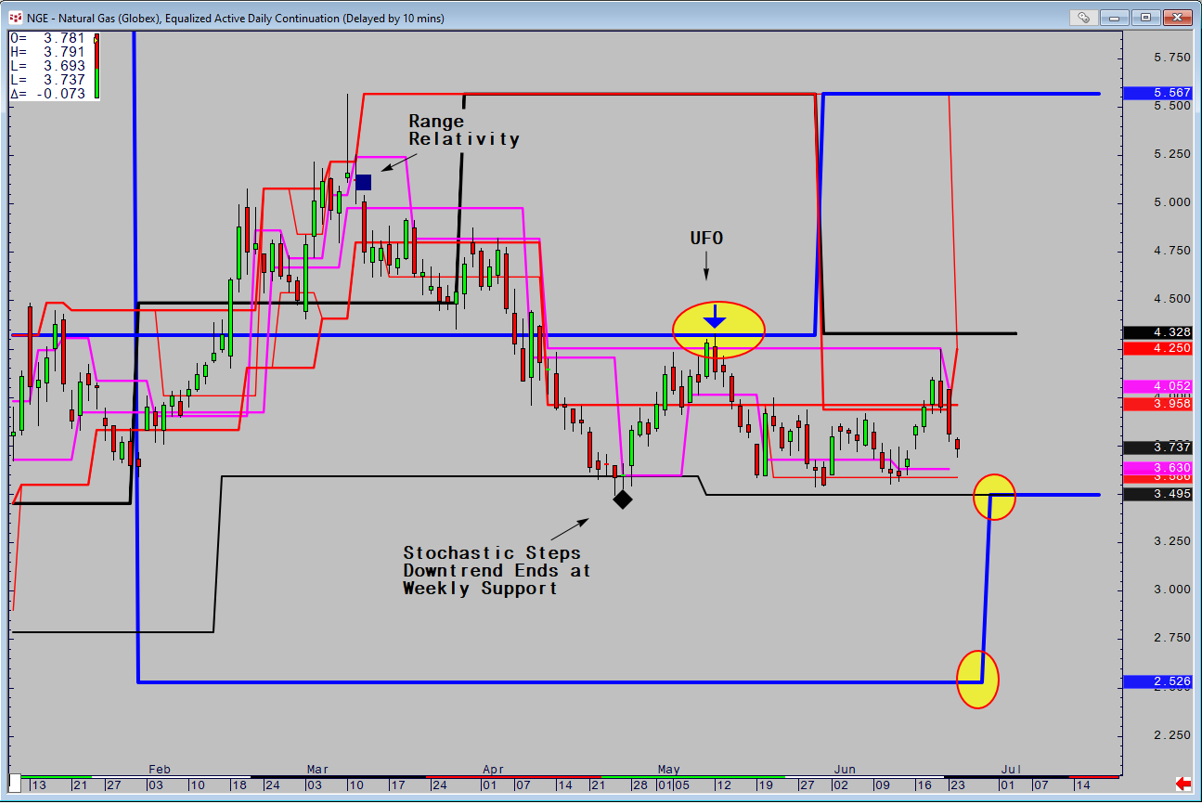
However, when the chart is equalized, there is a vastly different picture. Price went directly to the powerful monthly based resistance as circled and also produced one of my divergence-based patterns, in this case a UFO. (Price makes a 9 Bar high and the RSI a 3 Bar low). There are two other patterns on the chart. Range Relativity which qualifies overbought and oversold through the relationship of the daily close in relationship the weekly, monthly and quarterly based Range Deviation Pivots. Stochastic Steps is chapter 3 of the book and new code has been created to signal when the Stepping process has ended and therefore the trend is over.
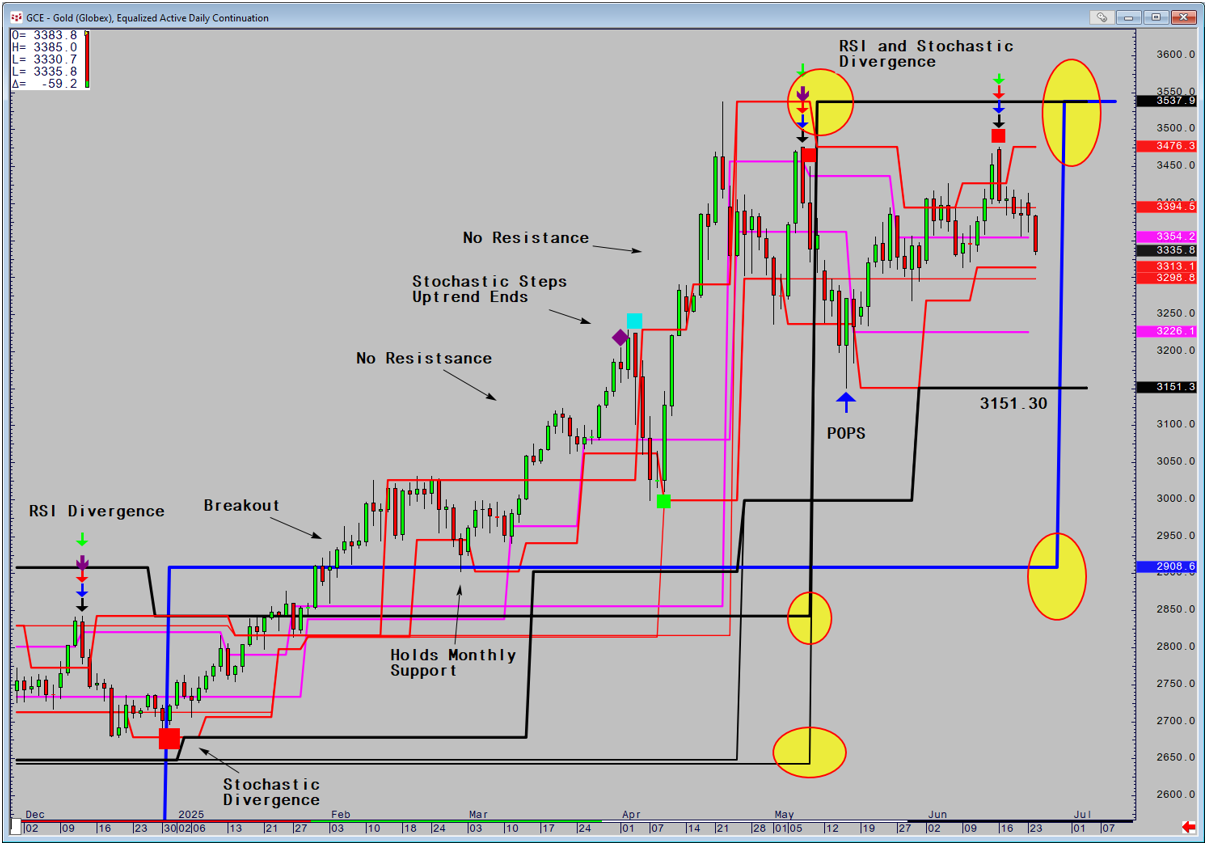
The supports and resistance in relationship to the current price and the changes that occur dictate my analysis and commentaries. Below is Gold. There are a variety of patterns that appear automatically when true. The breakout begins in early February and turns the major trend up when we close above the monthly and final resistance. The subsequent retracement then holds that monthly breakout point, Throughout March and April supports rise and there are periods where there is no resistance. A sharp fall occurs when the Stochastic Steps signals the end of the uptrend in early April, before a PowerPlay buy signal (green square) signals that the trend is restarting. We make new highs but as we come into May the picture changes dramatically. A series of daily supports become resistance before more significant weekly based levels move to the top as well (circled). Two sets of RSI and Stochastic Divergence patterns appear in what is now a sideways trend with a negative bias.
The Supports and Resistances also indicate where there are likely to move in the future. I know that if price does not make new all-time highs in June, then a monthly based support will also become a resistance (circled) and will weaken the technical picture further. Highlighting the risk of being long especially as Gold has got not benefit from recent Dollar weakness, is the fact there is no major support until 3151.30.
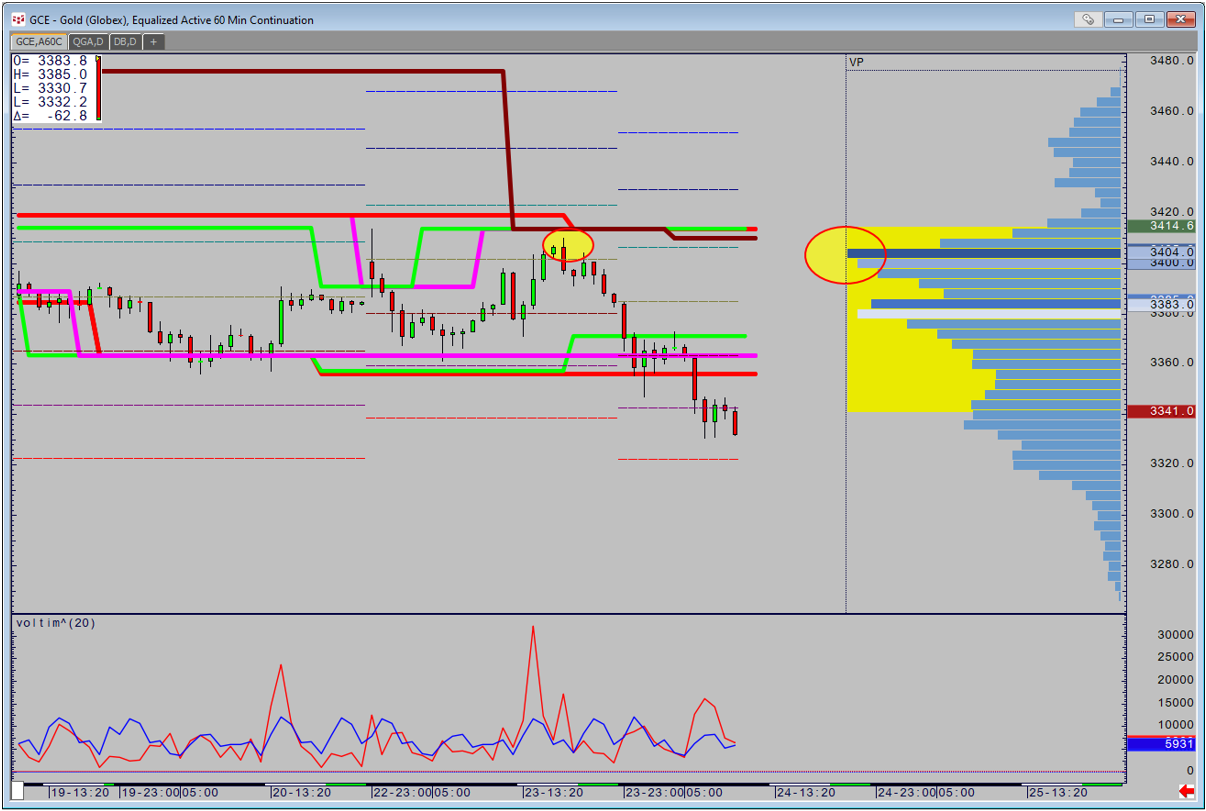
Peak Range and Volume can also be applied to intraday charts. This takes a 60-minute active equalized and applies the 120 (green), 240 (pink),360 (brown), and 720 minutes (red), along with the Volume Profile at the side and the Daily Range Deviation Pivots (dashes). The study below computes the current volume of the 60-minute time of day (red) against the 20-day average for the time of day (blue). Yesterday saw price fail at the high-volume point as circled before this morning has seen price break short-term support in high volume.
Fourth Dimension has no secrets, so in the coming issues I will be delving deeper into my suite of studies and explaining their logic. Next month we will look at the variety of uses of Range Deviation Pivots. In the meantime I can be contacted at shaun.downey@aol.com to answer any questions.
