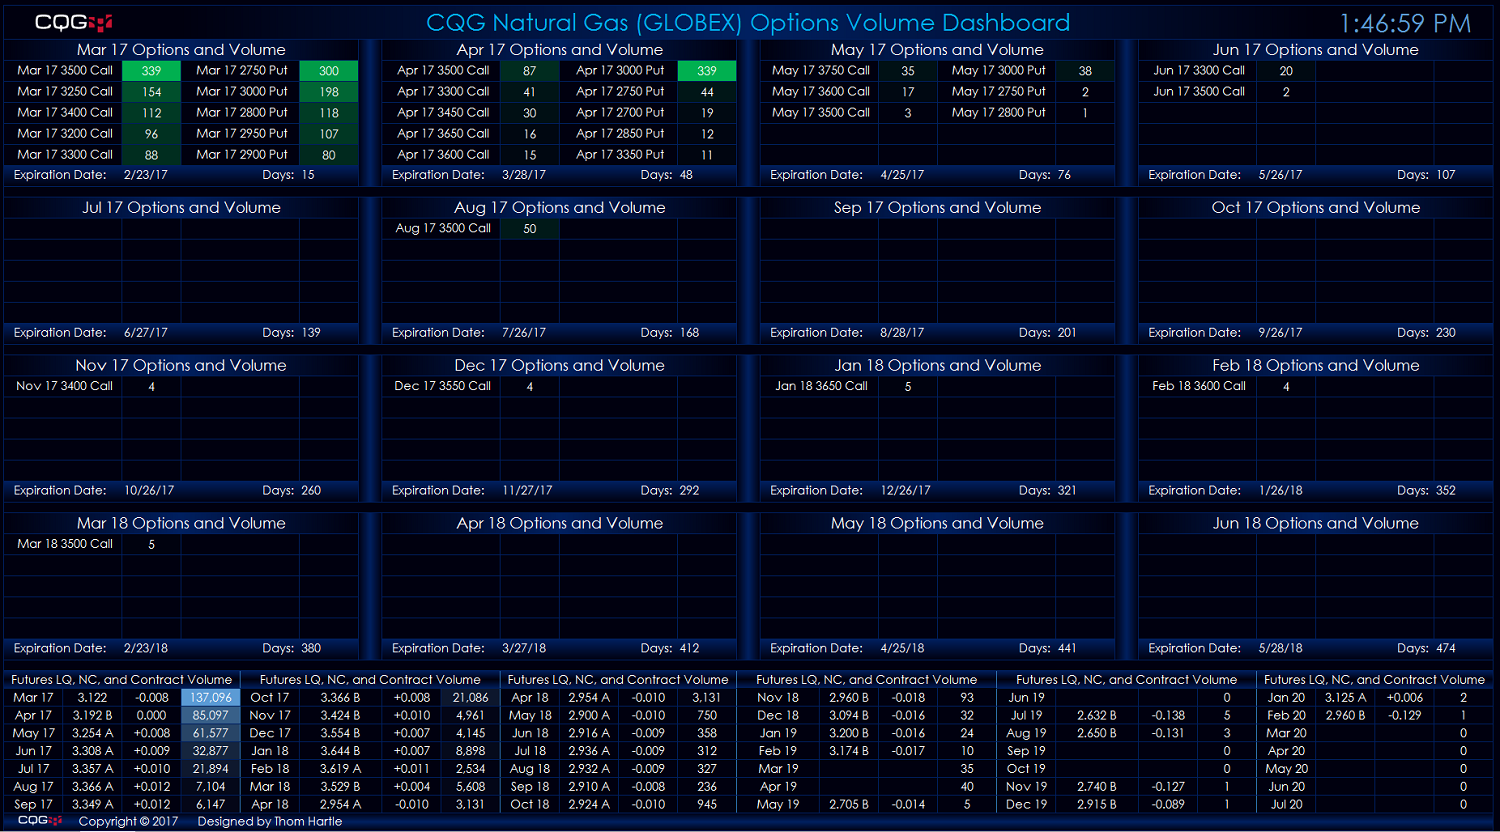
This Microsoft Excel® dashboard scans the options on the natural gas (Globex) futures market for volume and ranks the volume traded for each expiry out sixteen months. The scan covers options… more
Natural Gas
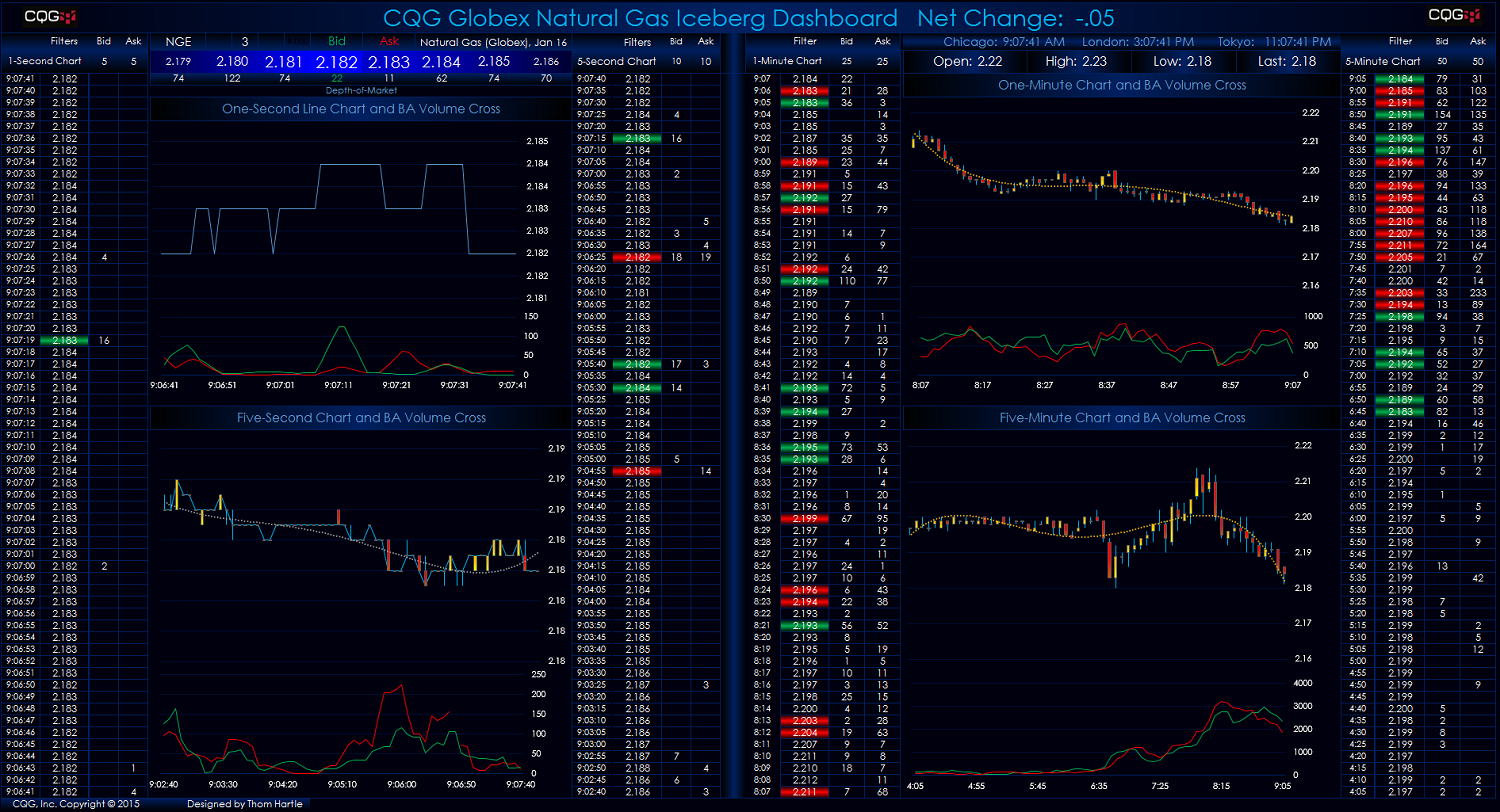
Customers using our flagship product, CQG Integrated Client (CQG IC), have access to a new study called Algo Orders. Using a proprietary algorithm, this indicator of trading activity detects and… more

The price of active month NYMEX natural gas futures closed on September 30, 2015 at $2.524 per mmBtu. The fourth and first quarters are generally a positive seasonal period for the energy… more
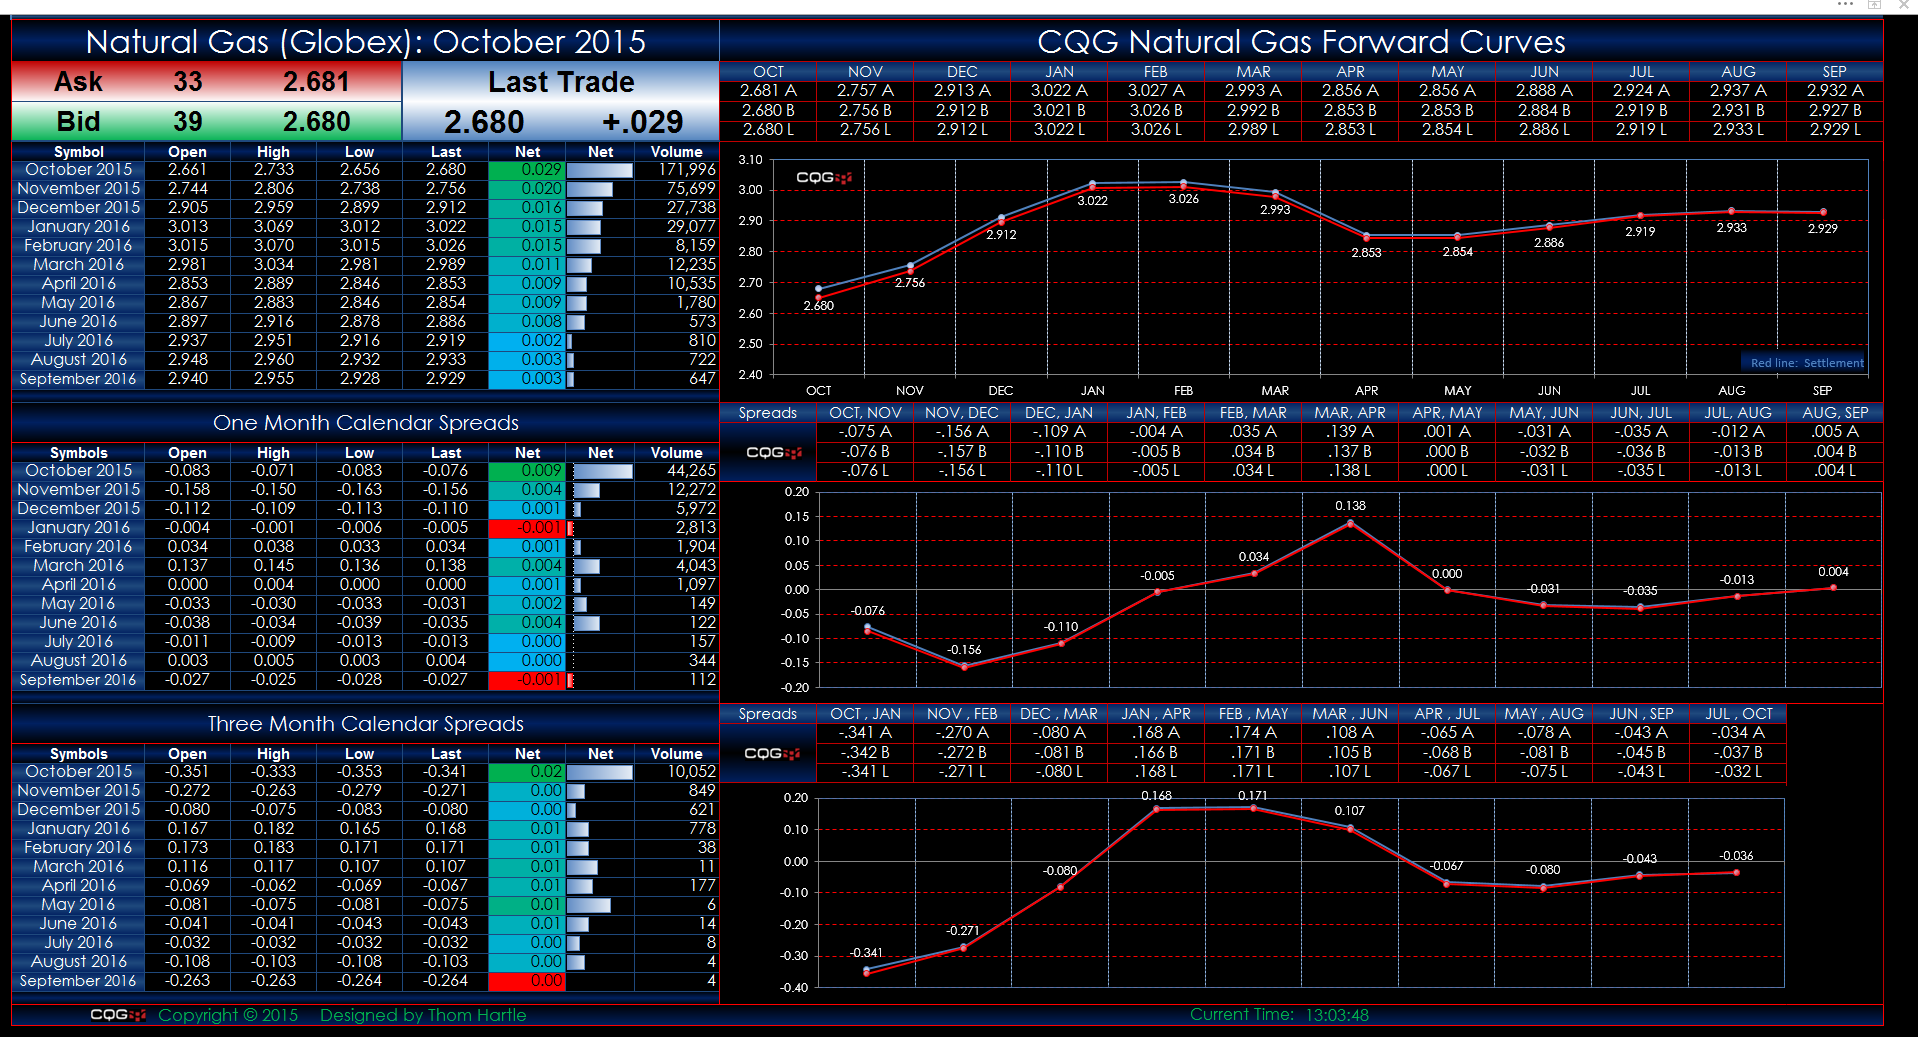
This Microsoft Excel® spreadsheet uses the CQG Toolkit to pull in market data for natural gas traded on CME Globex.
Twelve months of outrights, one-month, and three-month calendar spreads… more
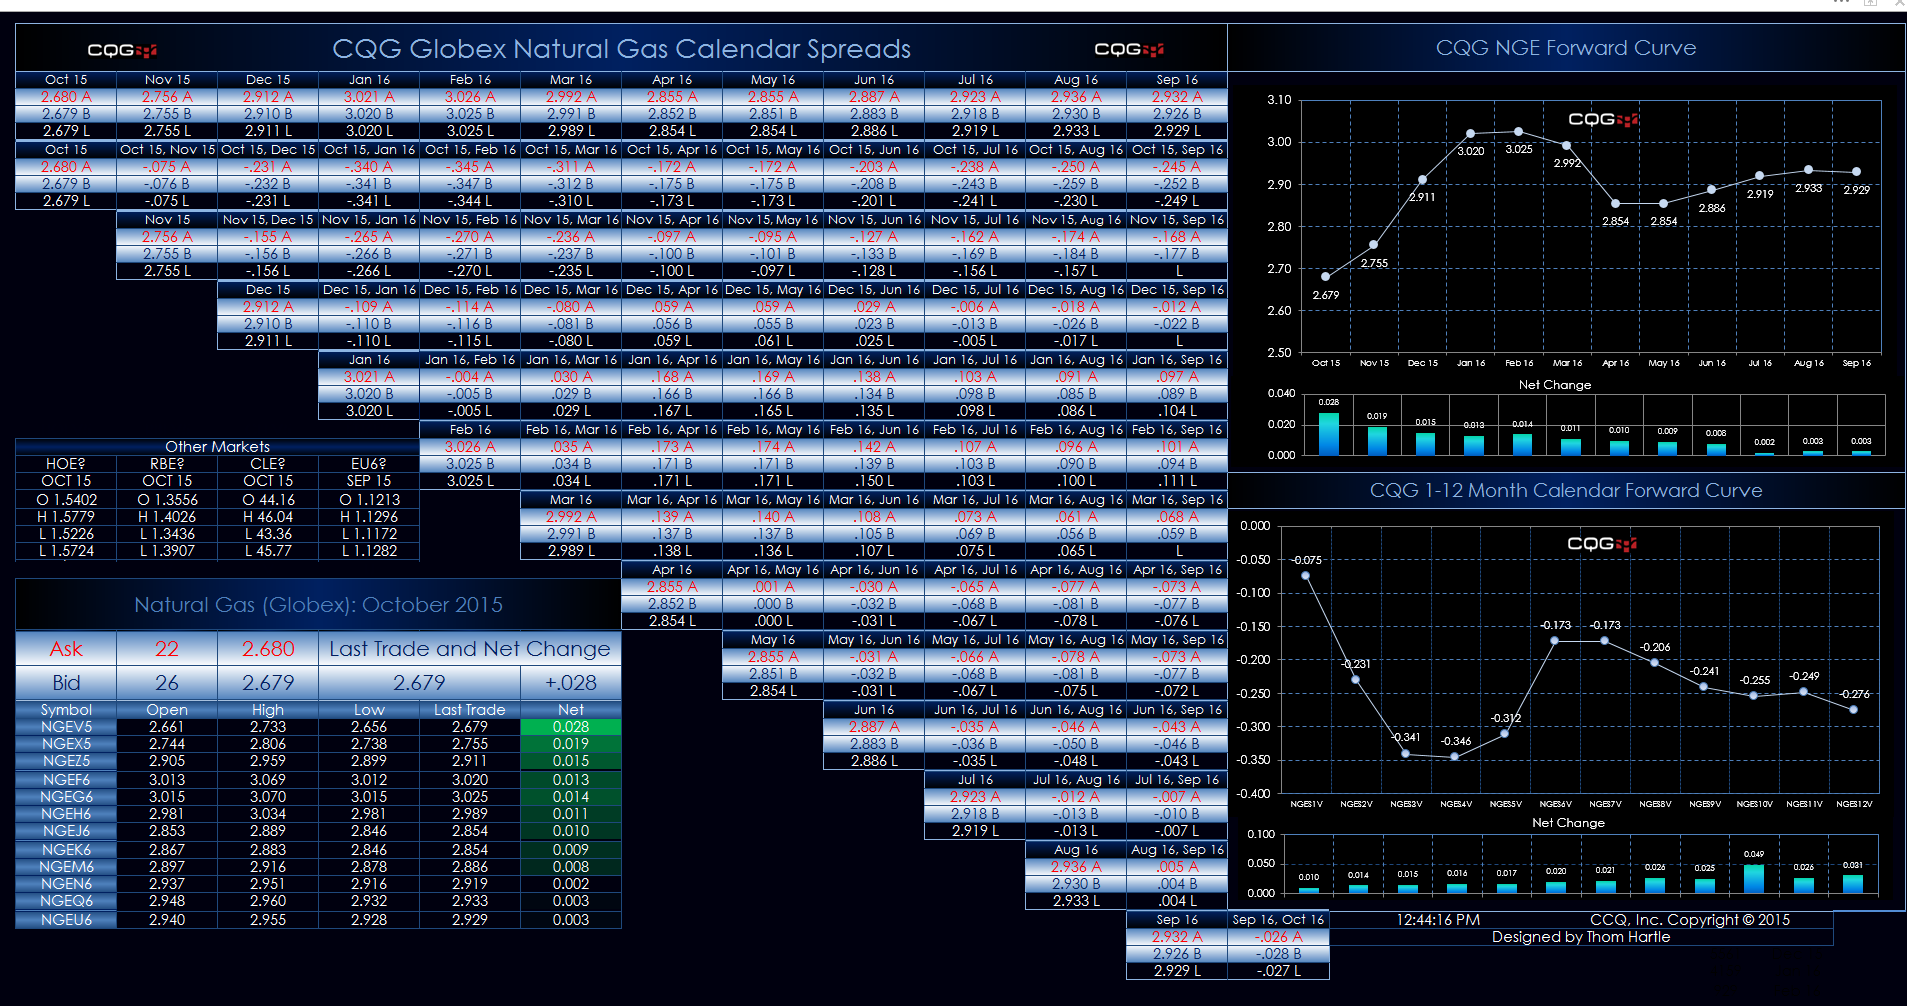
This Microsoft Excel® spreadsheet uses the CQG Toolkit to pull in natural gas market data traded on the CME Globex exchange. It uses a matrix style presentation with the outrights displayed along… more
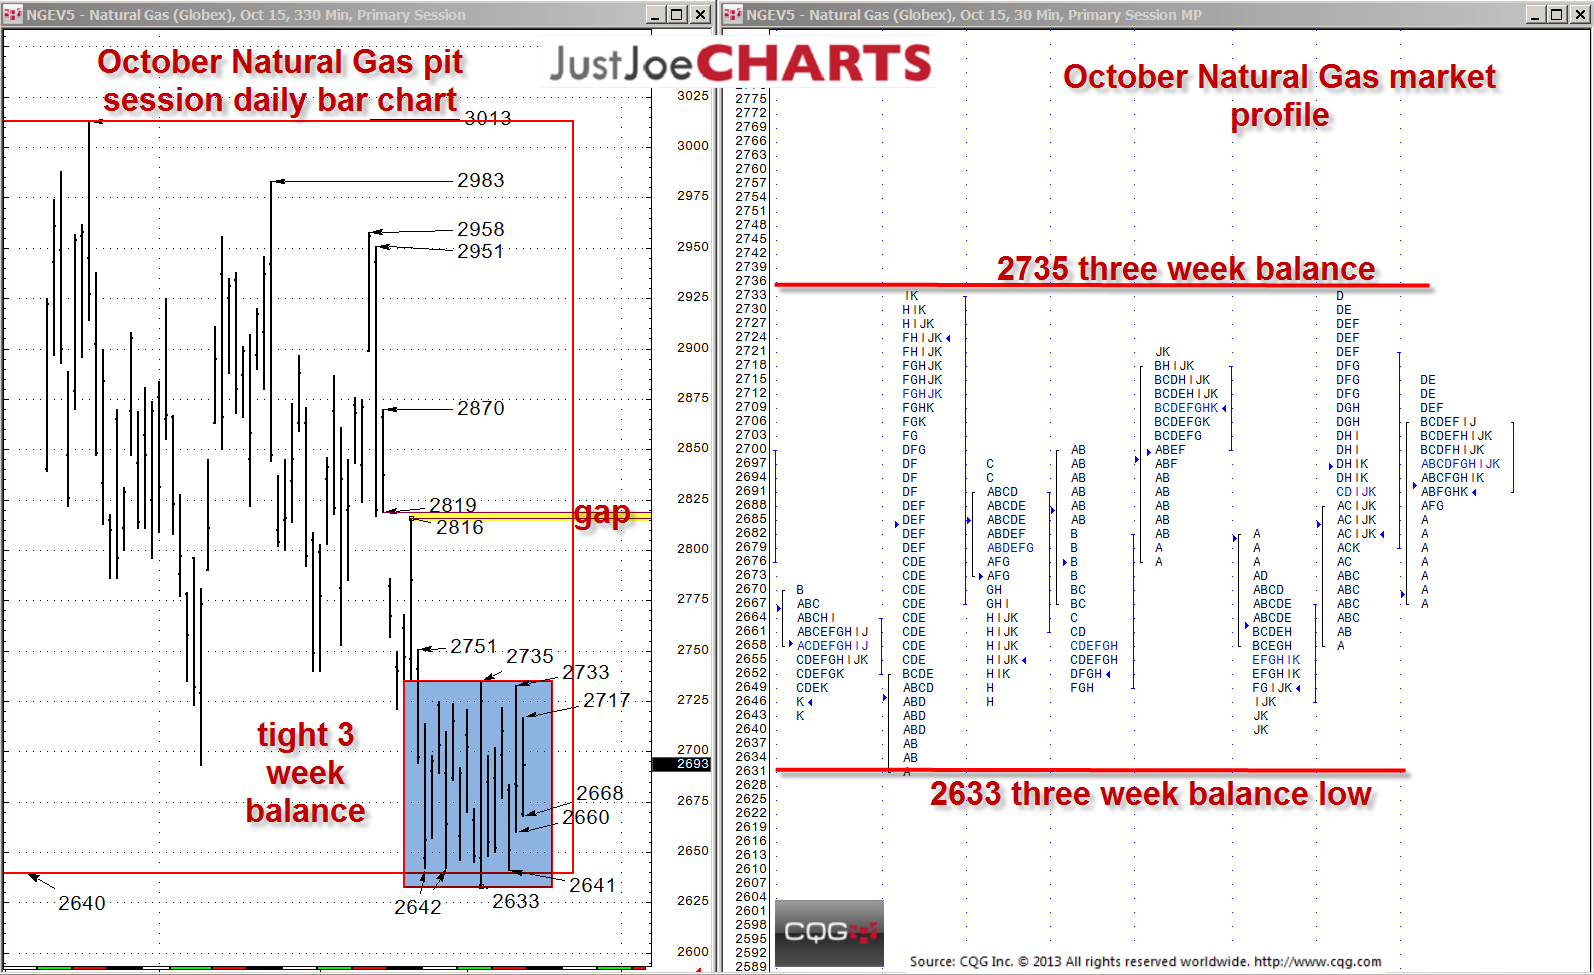
Two weeks ago, I wrote an article about how natural gas was testing the low of a several-month balance of 2640 to 3013. Additionally, at that time natural gas had formed a relatively… more
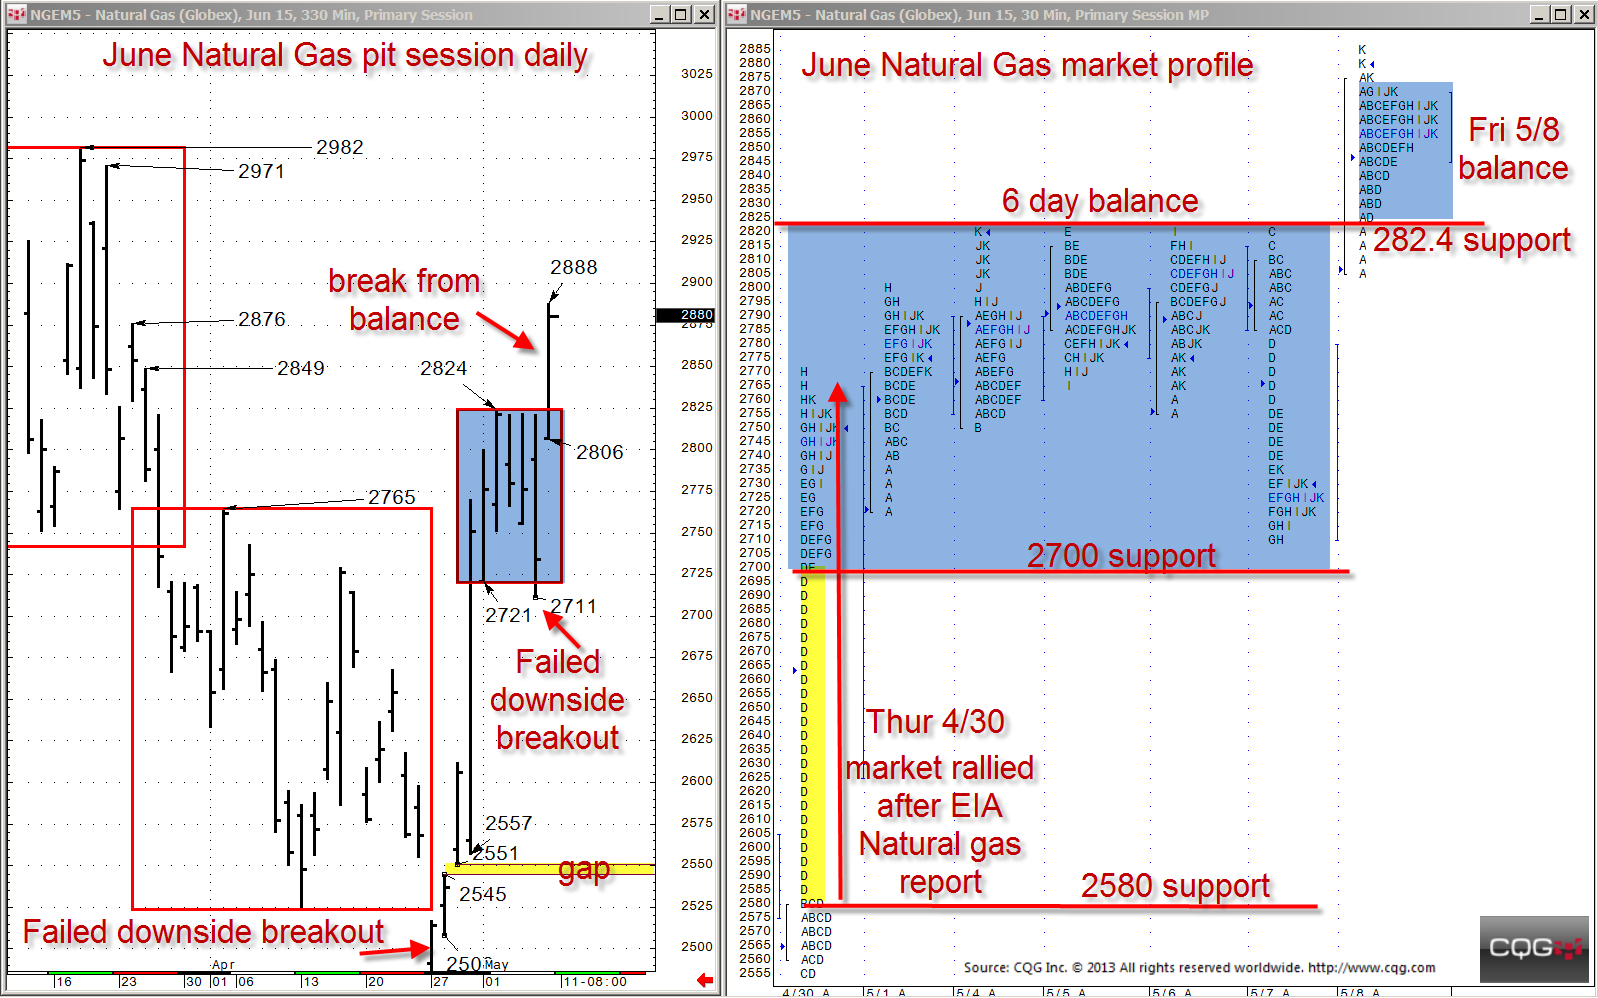
From the middle of March until the end of April, June natural gas held a steady decline from about 290.0 down to below 250.0. However, over the last ten days, much of that decline has been… more
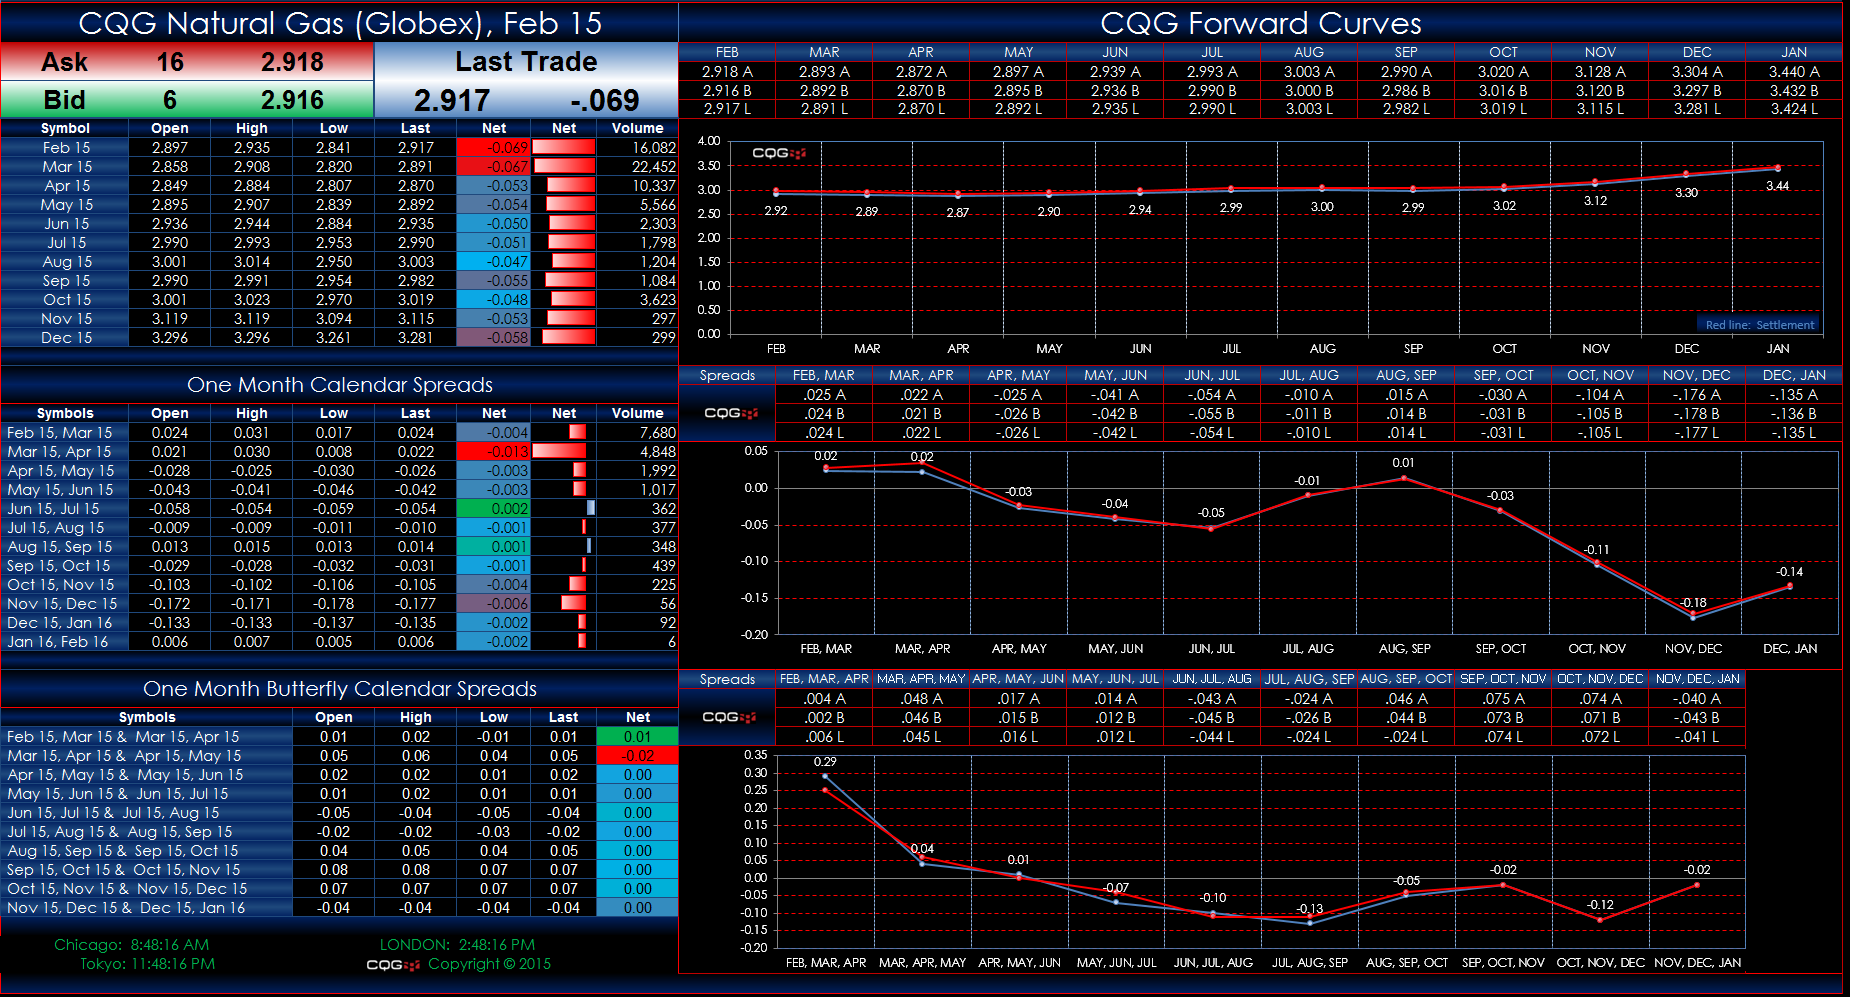
This Microsoft Excel® spreadsheet presents market data and forward curves of the Globex natural gas contracts. The data includes the outrights, exchange-traded calendar spreads, and synthetic… more
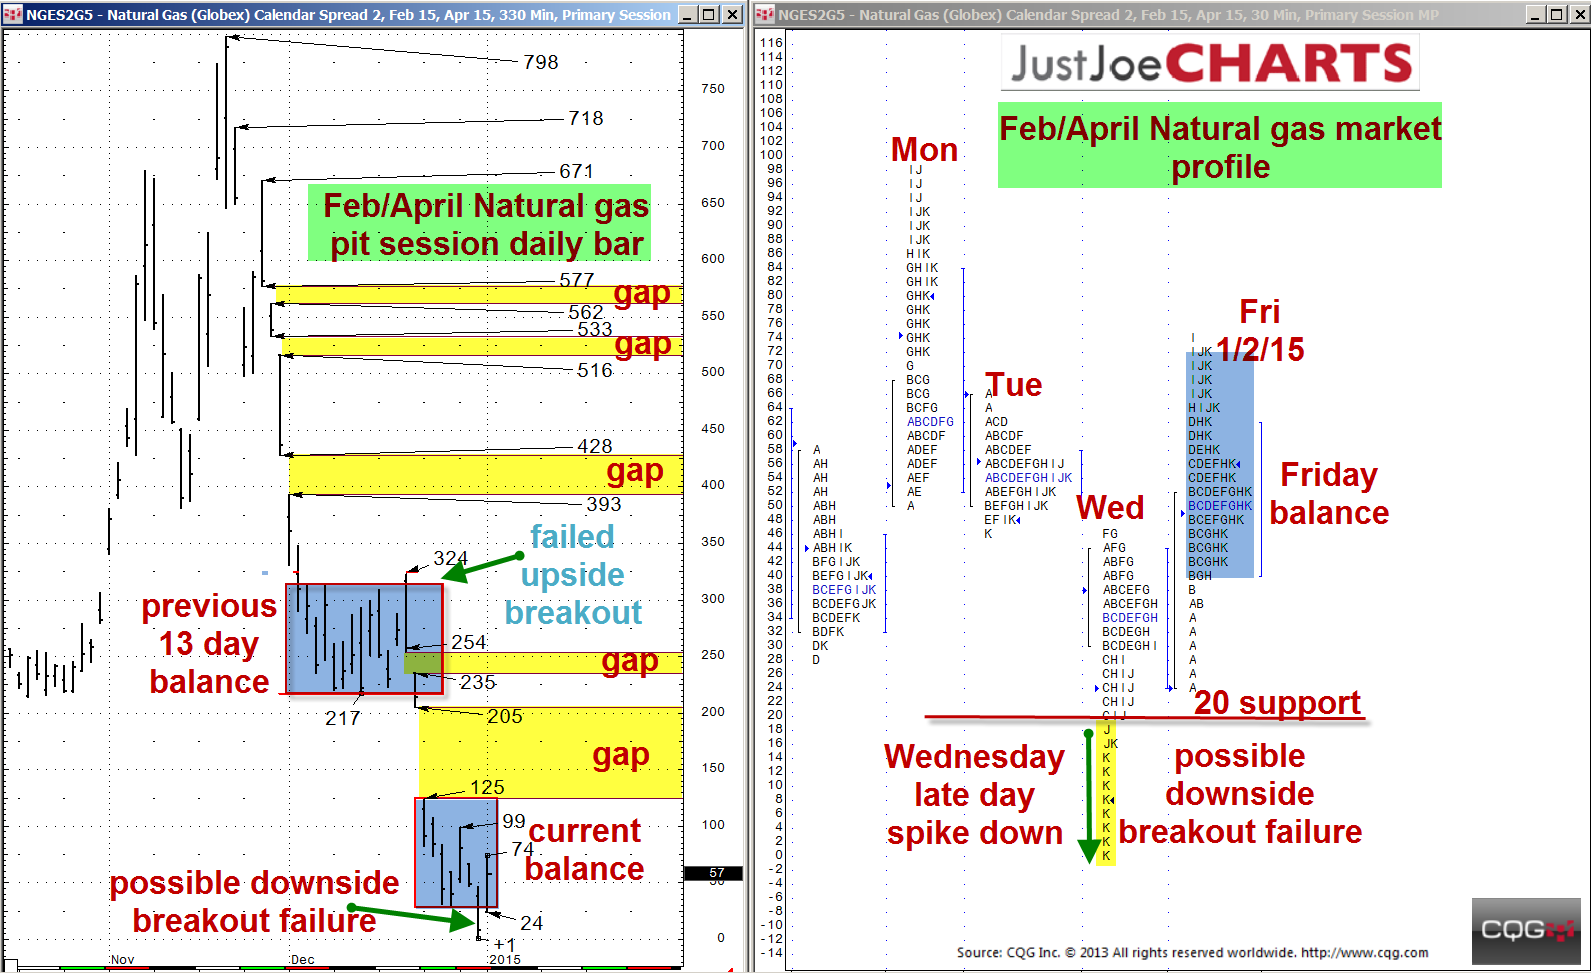
Over the last thirty trading days, the February/April natural gas spread has come off sharply about 800 points, leaving several gaps along the way. A few weeks ago, after the spread fell about 500… more
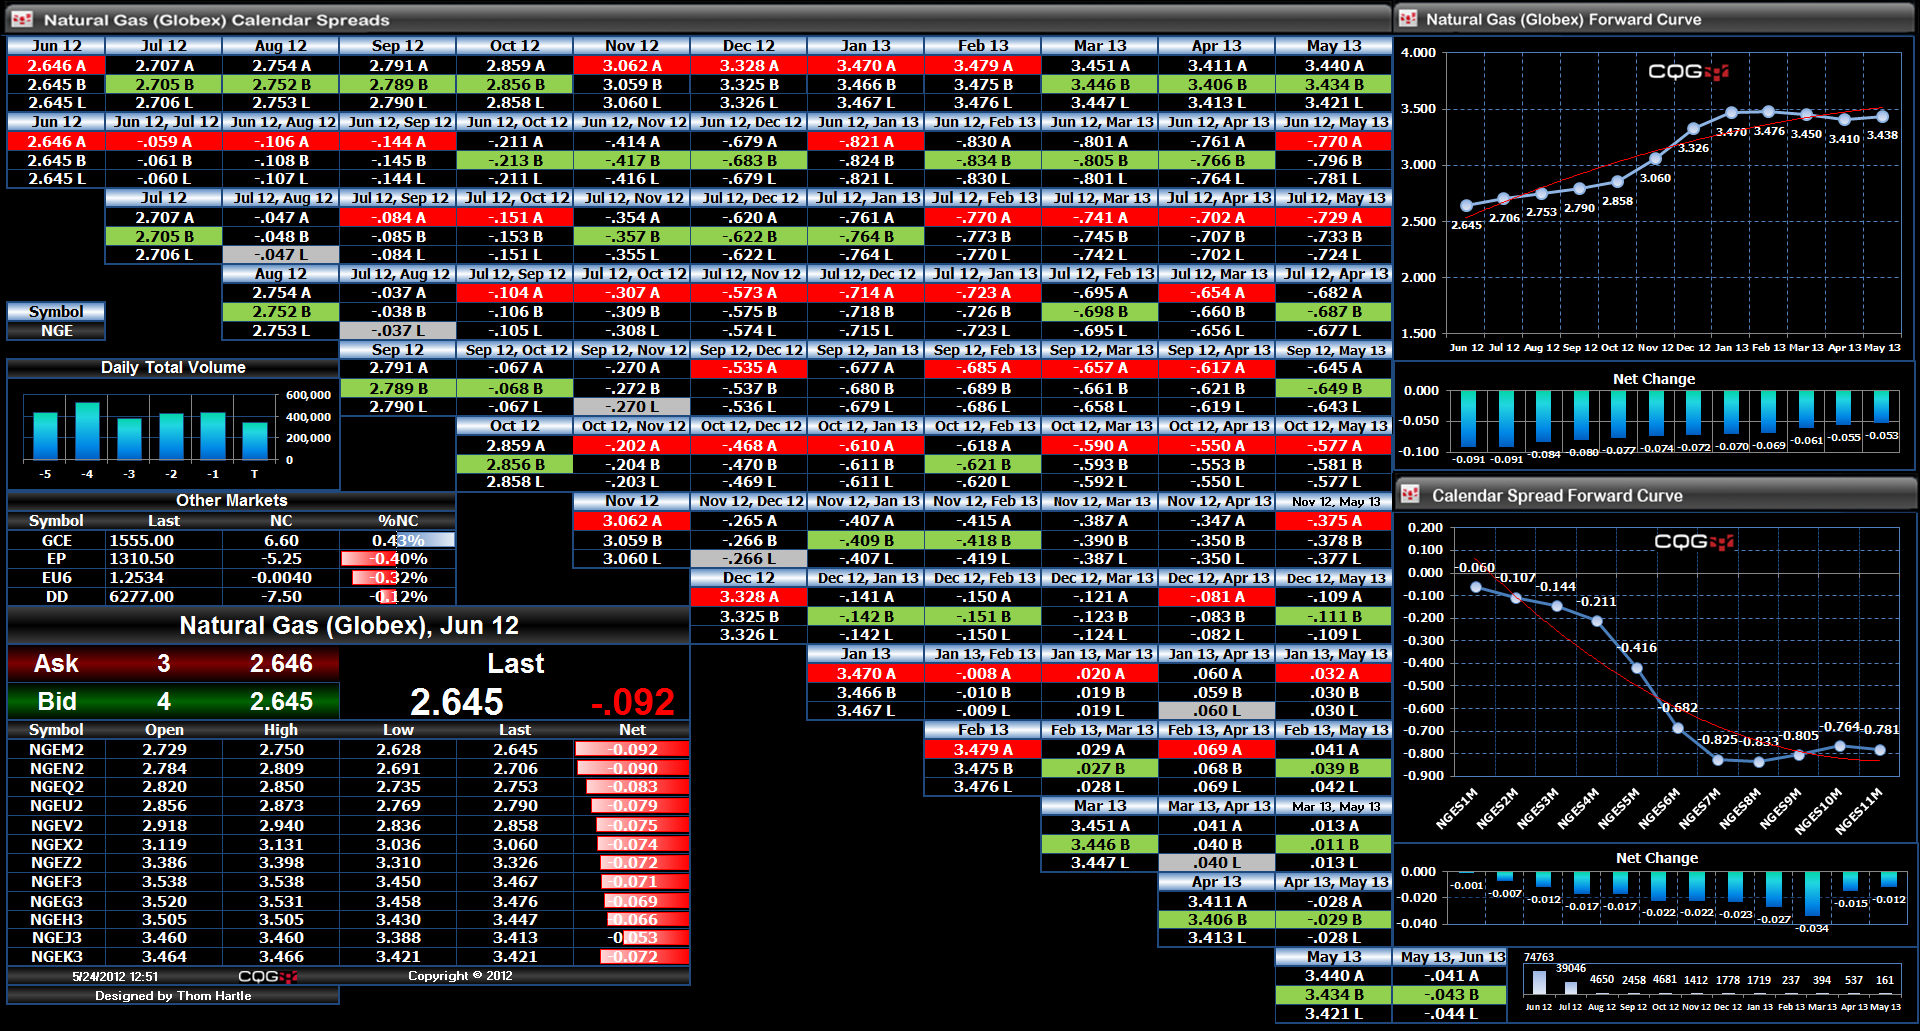
This Microsoft Excel® spreadsheet uses a matrix format to show the natural gas market traded on the CME Globex electronic trading platform.
This dashboard screen capture shows the… more