The forward curves dashboard displays futures contracts White Maize (symbol: WMAZ), Yellow Maize (symbol: YMAZ), Wheat (symbol: WEAT), Soybeans (symbol: SOYA), and Sunflower Seeds (symbol: SUNS),… more
Spreads
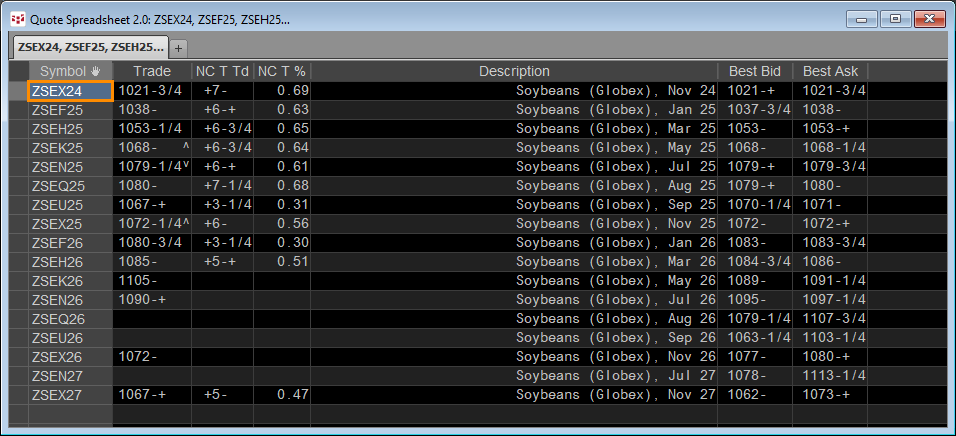
In the CQG Quote Spreadsheet the first symbol of a list of symbols can be entered and then hitting the key combination of CTRL+Enter will populate the spreadsheet with all of the available symbols… more
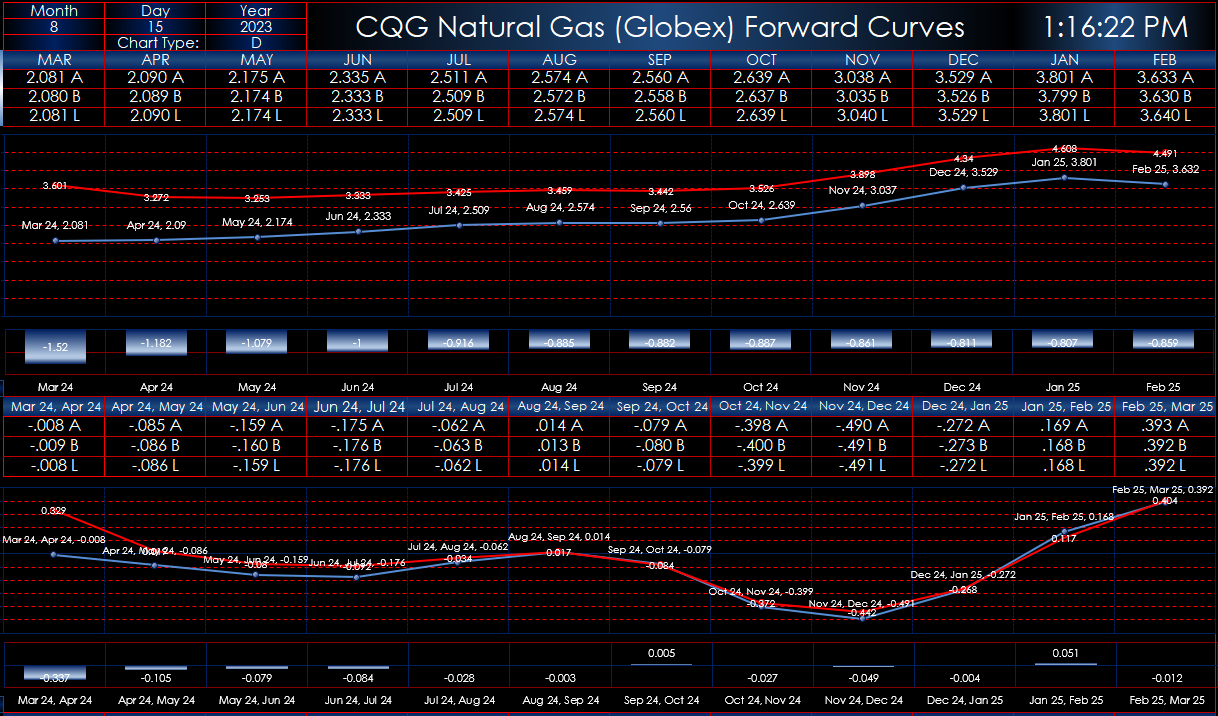
This Microsoft® Excel dashboard uses RTD formulas based on a user input symbol (please use all capital letters) to display a forward curve of the outrights and forward curves for six calendar… more
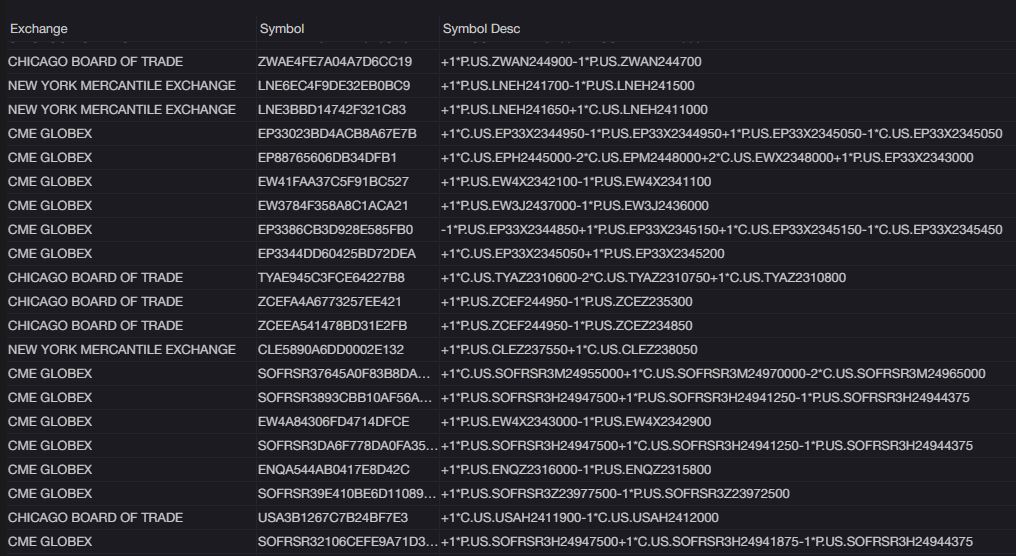
CQG One provides an "Active RFQ" widget. A Request for Quote (RFQ) is functionality provided for traders to access electronic quotes on multi-leg options strategies. It is an electronic message… more
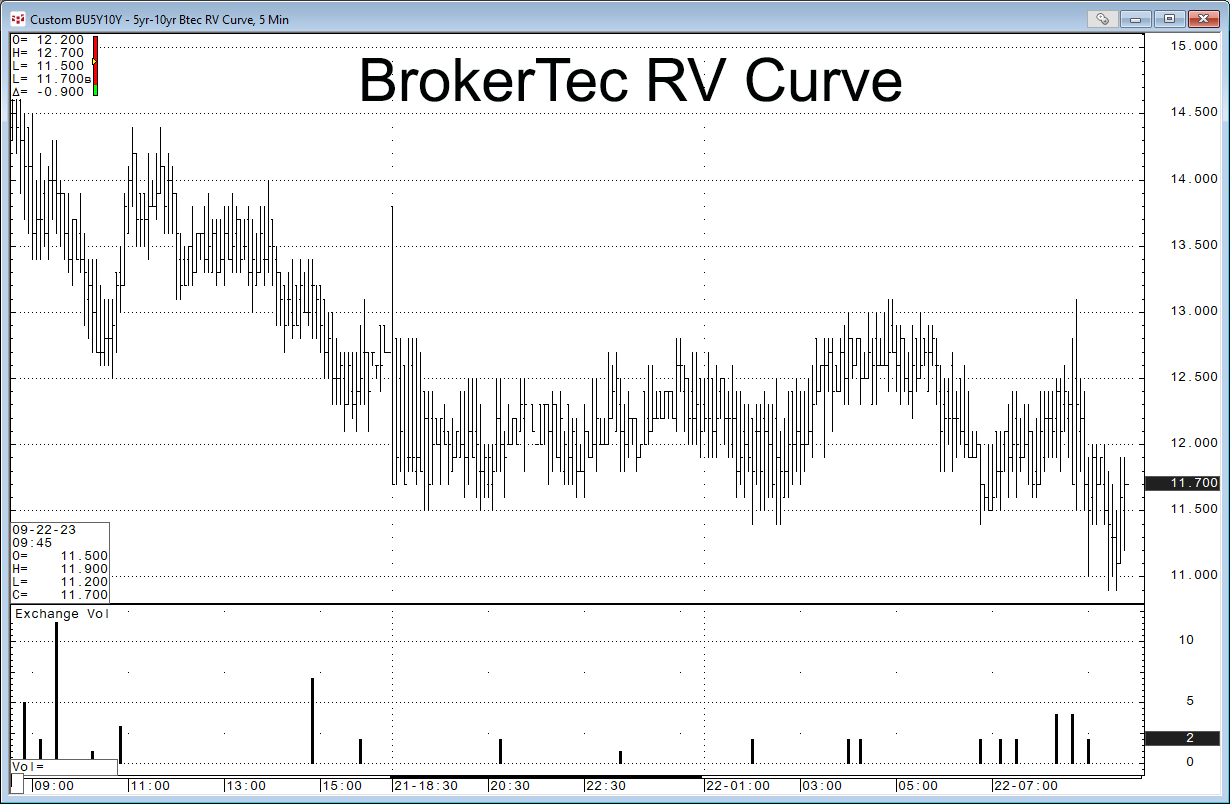
Customers of BrokerTec can now trade the Relative Value (RV) Treasury Spreads. BrokerTec is the price discovery leader for benchmark cash U.S. Treasuries.
RV Curve offers 21 spreads. This… more
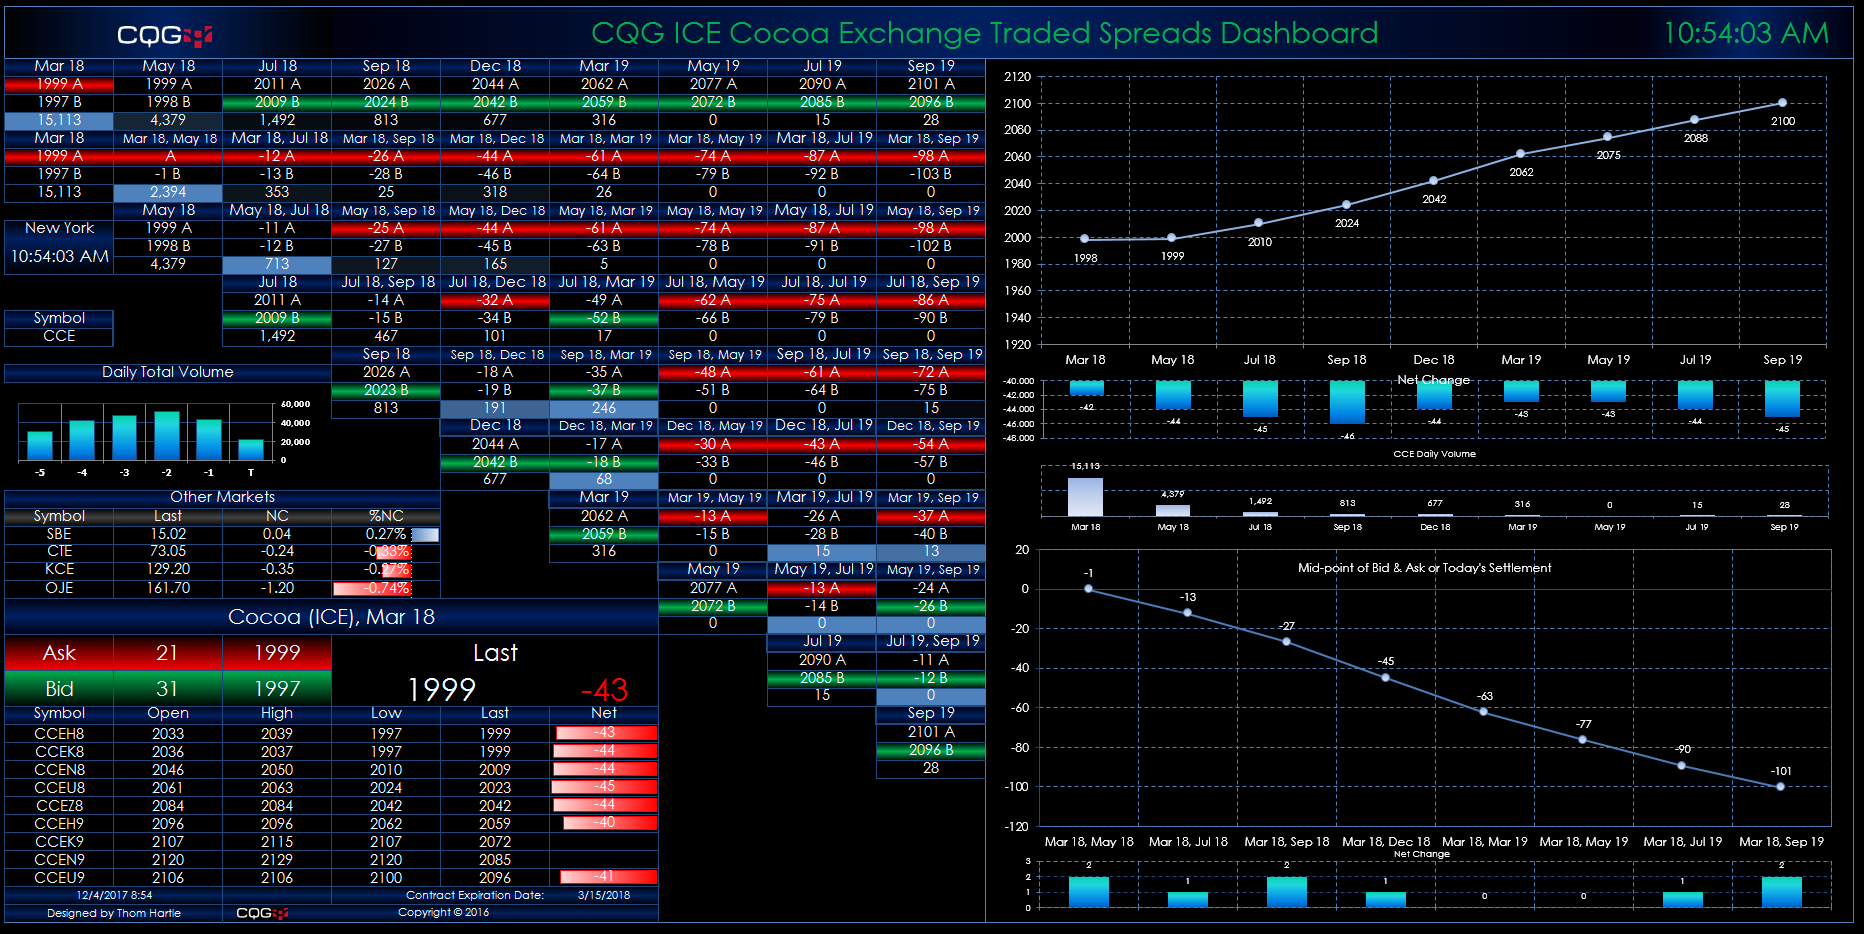
This Microsoft Excel® dashboard displays market data for cocoa spreads traded on the ICE platform using a matrix-style format. The outrights are along the top row and at the start of each row. The… more
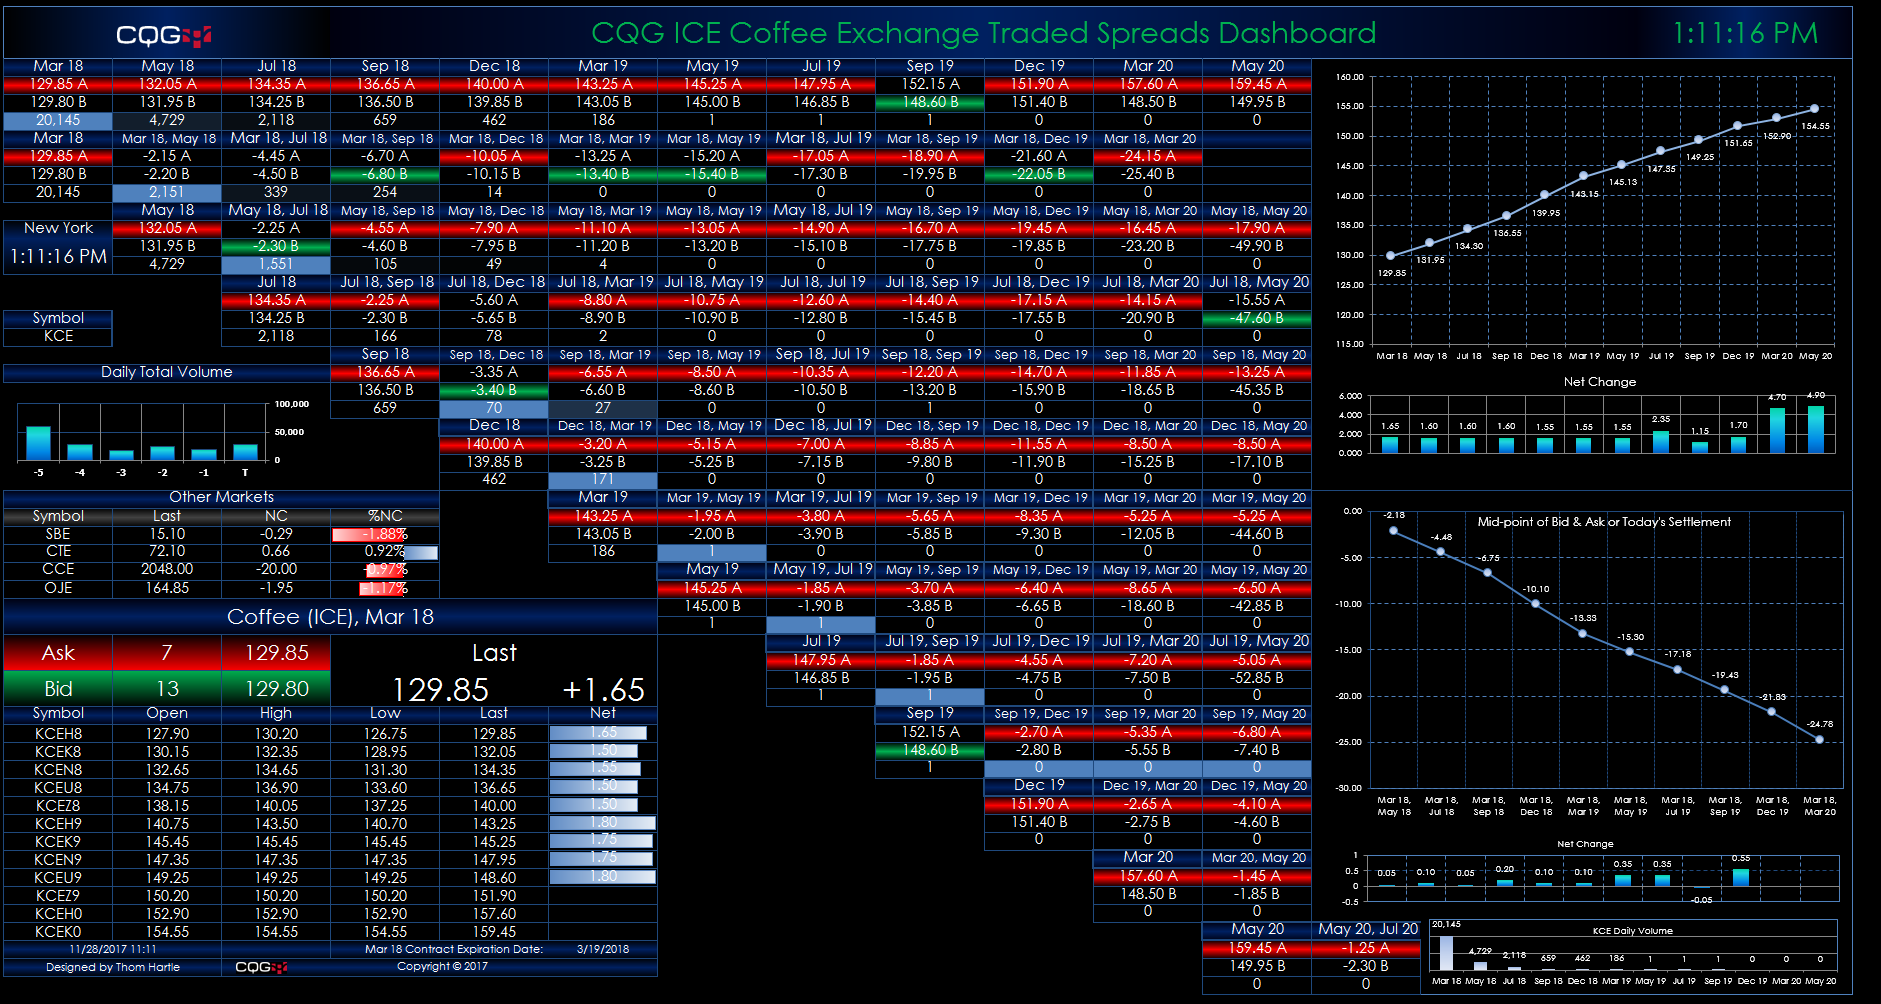
This Microsoft Excel® dashboard displays market data for coffee spreads traded on the ICE platform using a matrix-style format. The outrights are along the top row and at the start of each row.… more
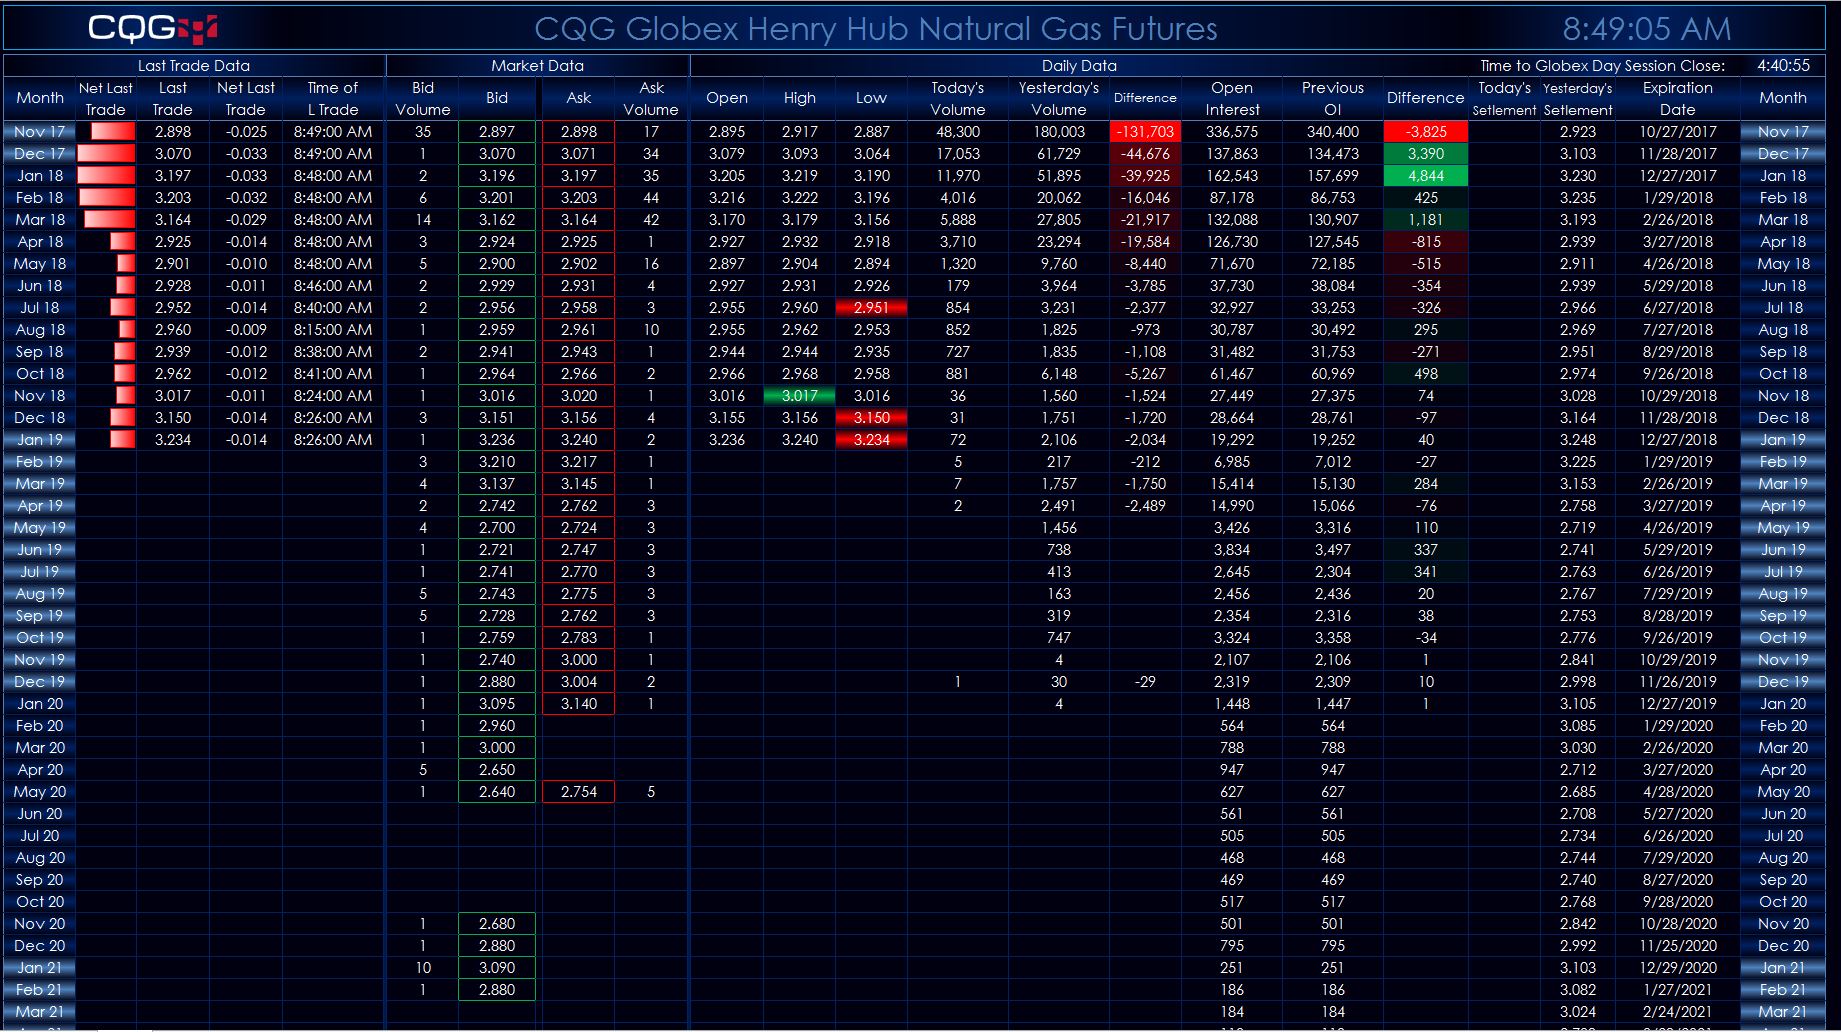
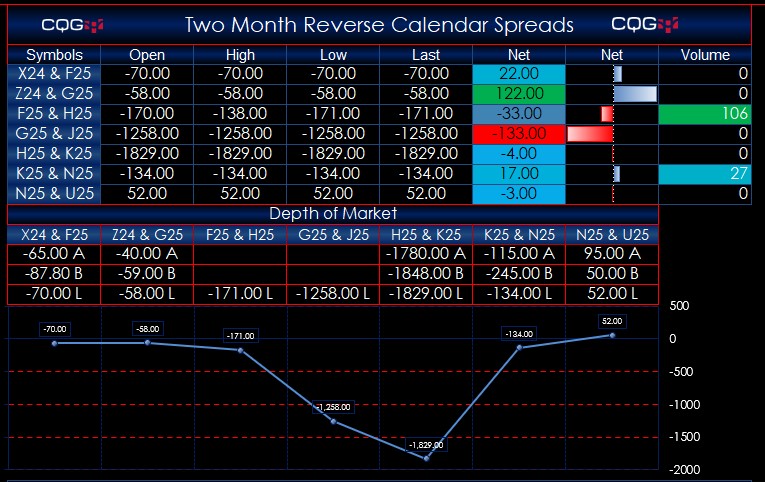
This Microsoft Excel® dashboard has three tabs. The first tab displays today’s market quotes, volume, and open interest data. If the last price is matching the open price, then the open price… more
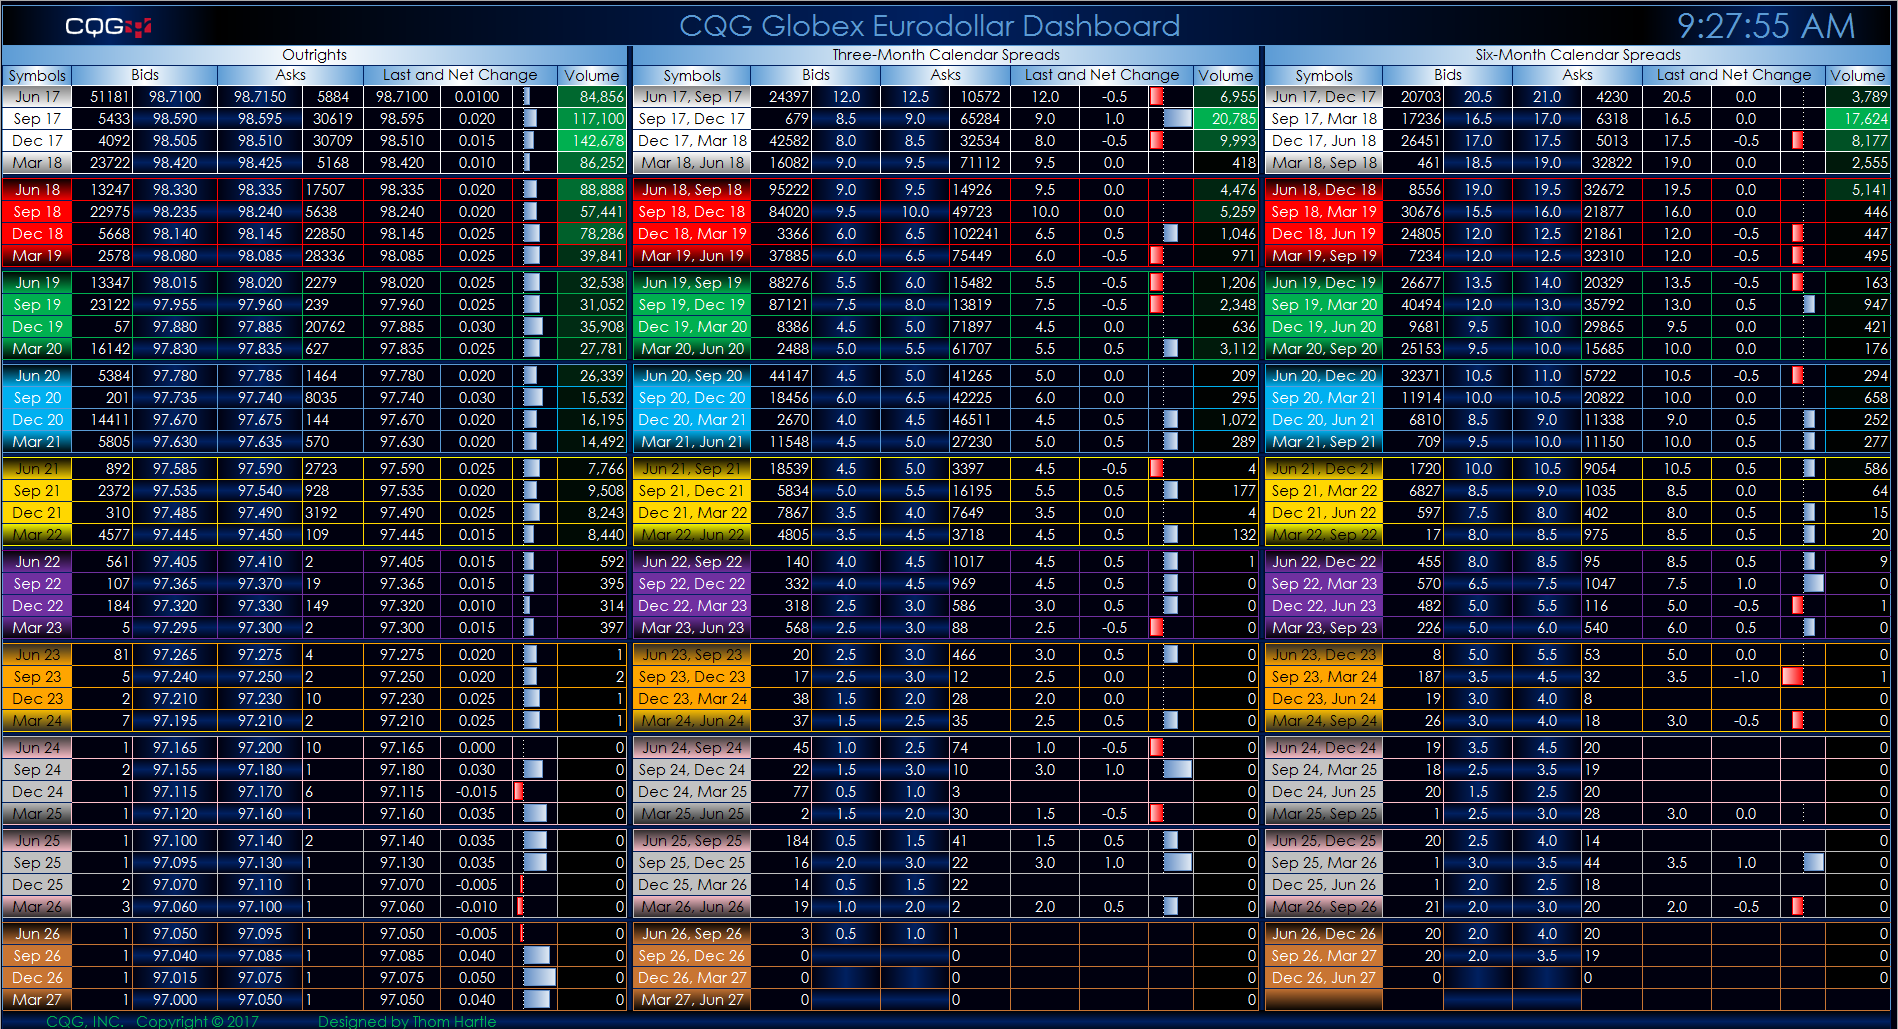
This Microsoft Excel® spreadsheet presents Eurodollar market data. The data includes ten years of quarterly contracts for outrights and exchange-traded three-month and six-month… more

This Microsoft Excel® spreadsheet presents Globex crude oil market data and forward curves. The data includes outrights, exchange-traded calendar spreads, and butterfly spreads. The exchange-… more