This Microsoft Excel® dashboard displays market data for Short Sterling calendar spreads traded on the ICE platform. This monitor uses a matrix-style format. The outrights are displayed along the top row and at the start of each row. The best bid and best ask are also displayed. If the latest quote is a new bid, then the bid price is highlighted in green. If the latest quote is a new ask, then the ask price is highlighted in red.
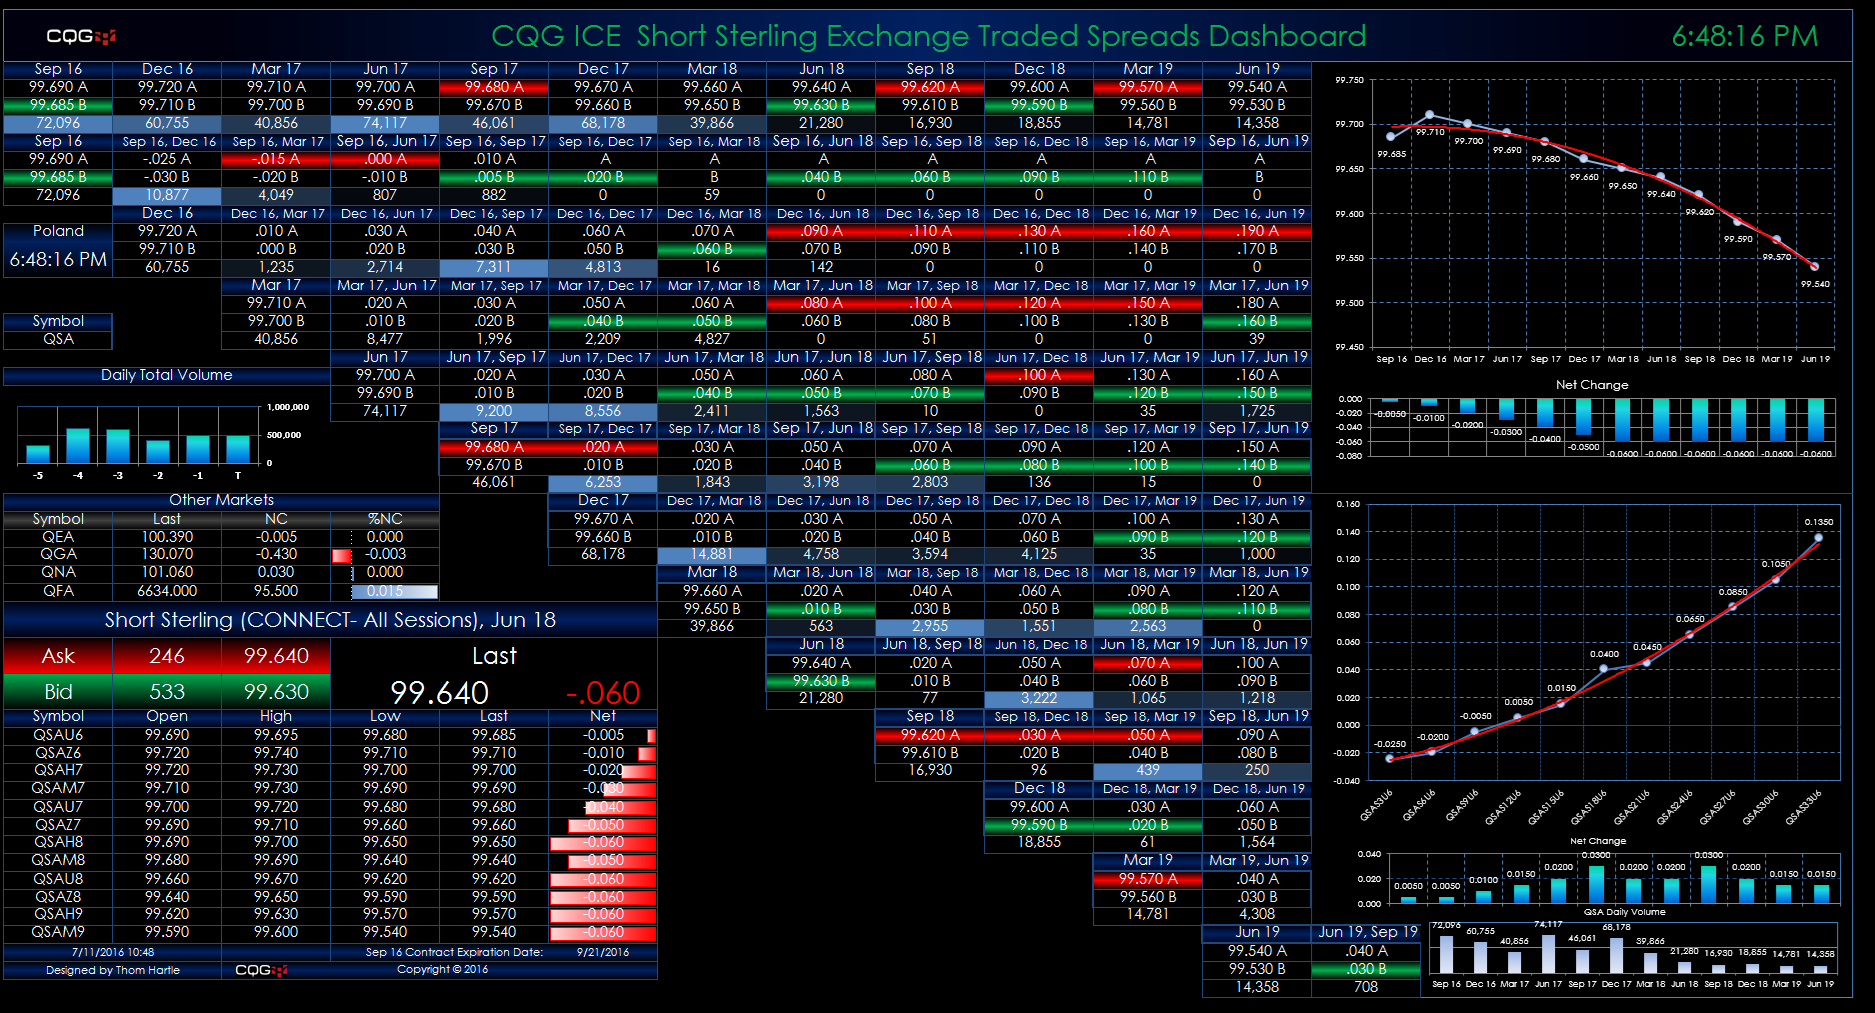
Below the best bid row for each contract is today’s traded volume for each calendar spread. Each volume row is heat-mapped using black for the lowest traded volume and increasing levels of intensity of blue to indicate higher levels of traded volume. The outright contract at the start of each row is not included in the heat-mapping comparison.
The two forward curve charts use the last trade for the data points unless the last trade is outside of the best bid and best ask. In that case, the mid-point of the best bid and best ask is substituted. The red line is a polynomial regression line.
Requires CQG Integrated Client or CQG QTrader and Excel 2010 or more recent.