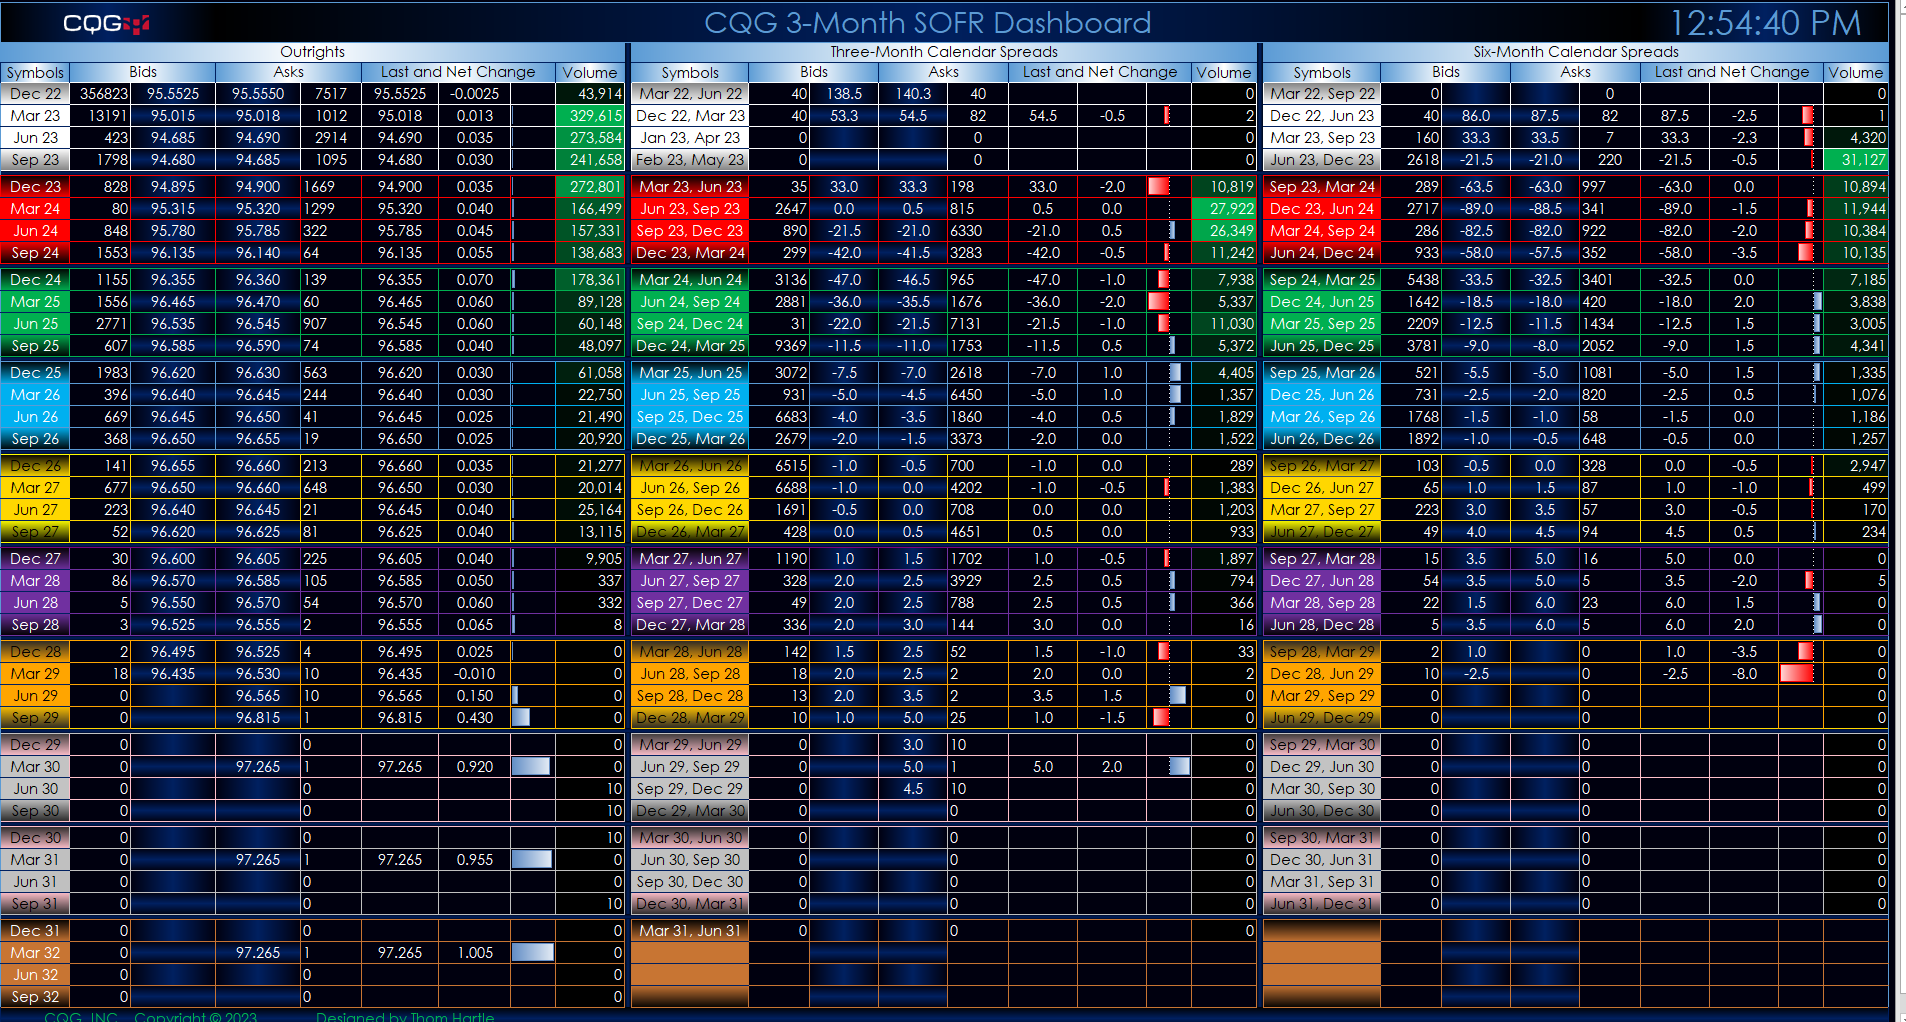
This Microsoft Excel® spreadsheet presents 3-Month SOFR market data. The data includes nearly ten years of quarterly contracts for outrights and exchange-traded three-month and six-month calendar… more
Calendar Spreads
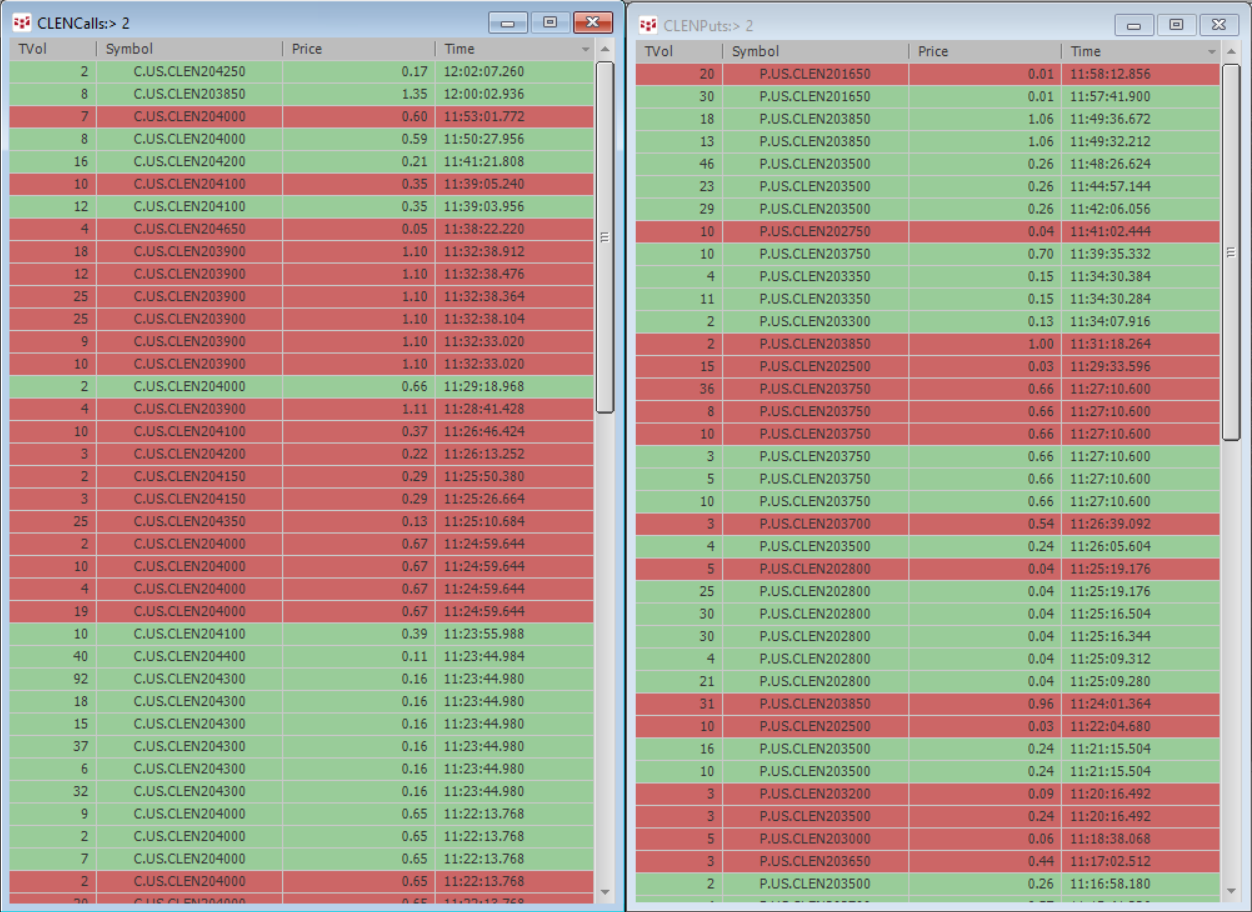
CQG’s Portfolio T&S Monitor displays trades using a time & sales format for a portfolio of instruments. The standard T&S display shows you trading activity for just one instrument.… more
This Microsoft Excel® dashboard displays market data for Euribor calendar spreads traded on the ICE platform. This monitor uses a matrix-style format. The outrights are displayed along the… more
This Microsoft Excel® dashboard displays market data for Euribor calendar spreads traded on the ICE platform. This monitor uses a matrix-style format. The outrights are displayed along the… more
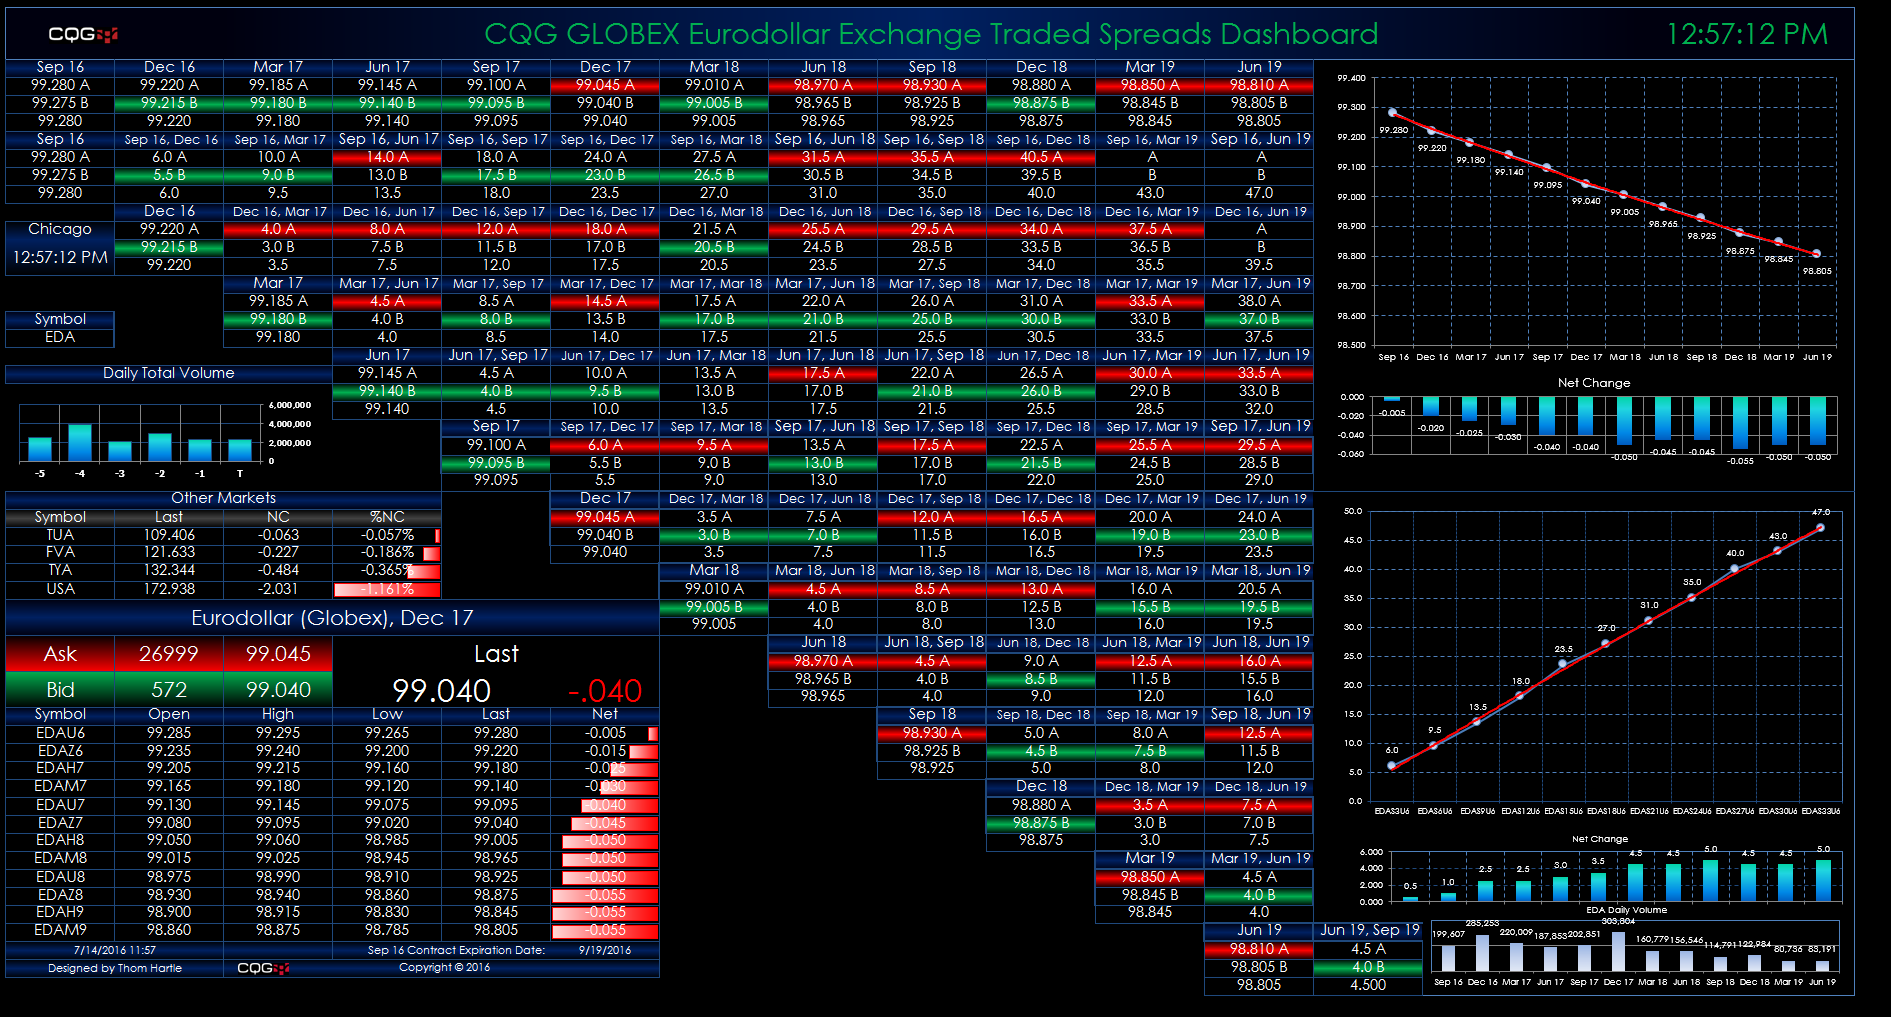
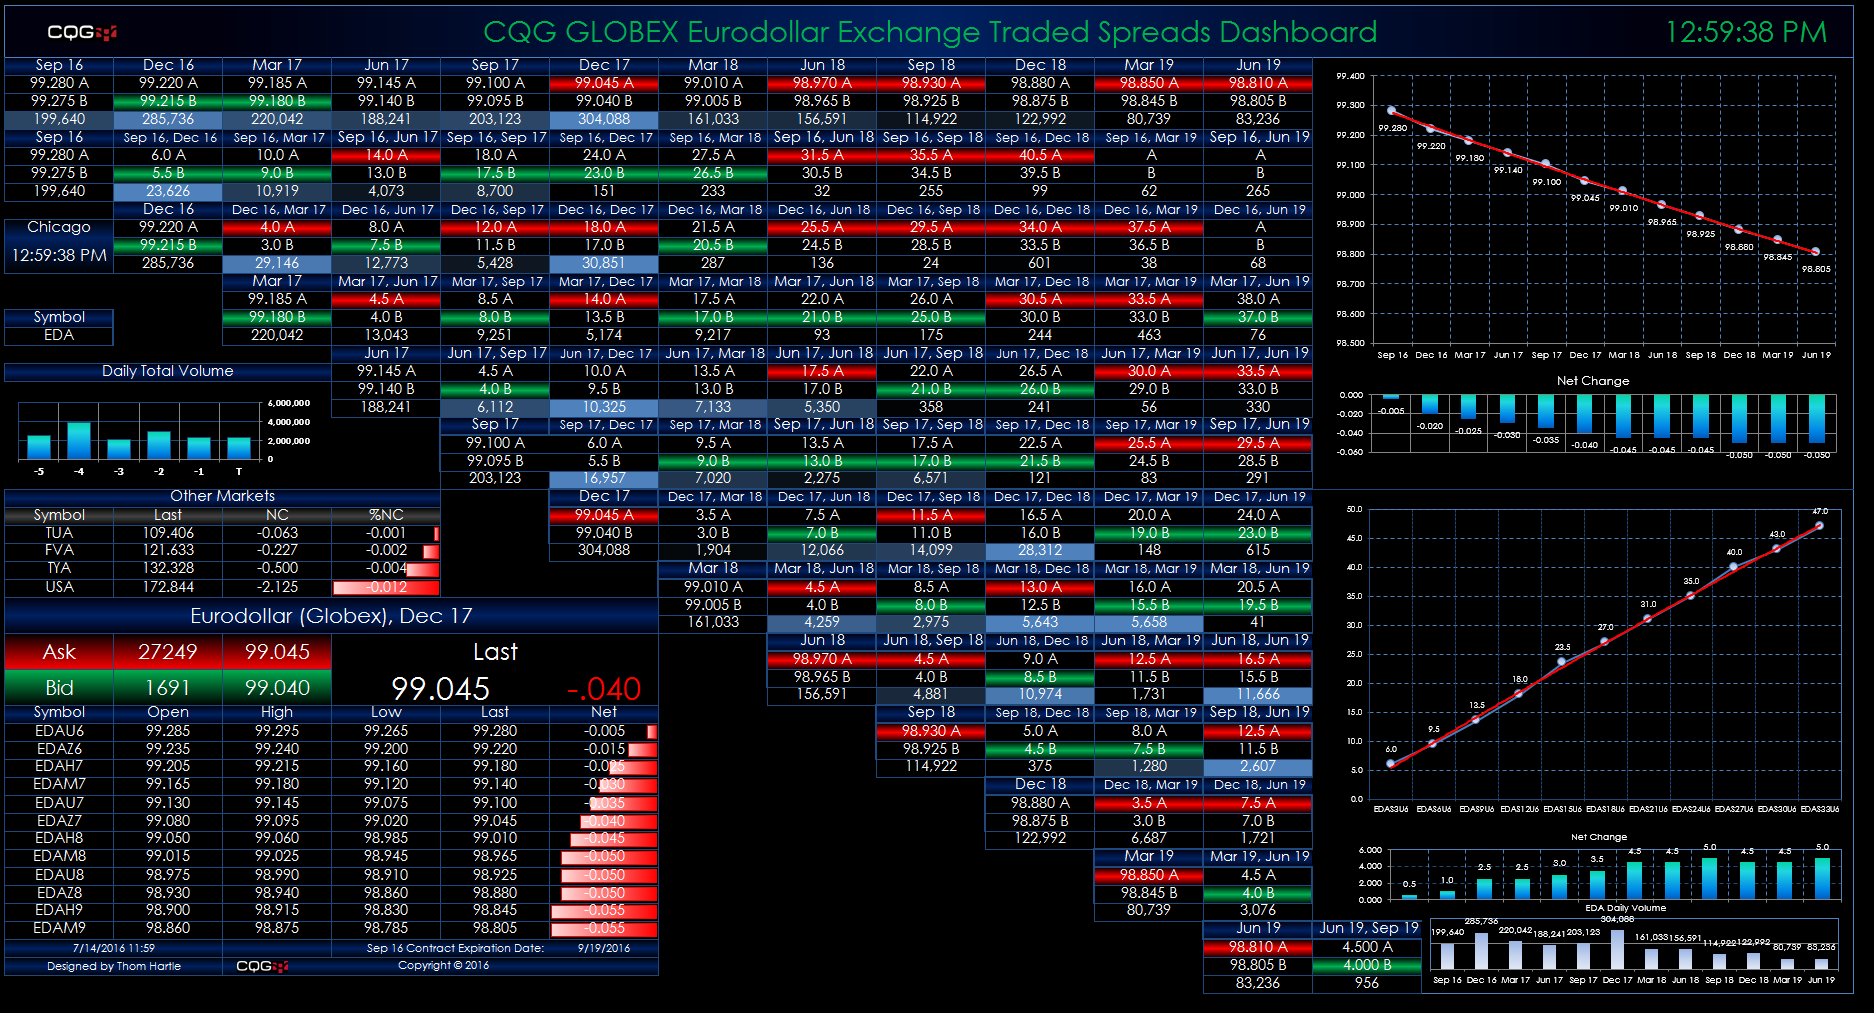
This Microsoft Excel® dashboard displays market data for Eurodollar calendar spreads traded on the CME Globex platform. This monitor uses a matrix-style format. The outrights are displayed… more
This Microsoft Excel® dashboard displays market data for Eurodollar calendar spreads traded on the CME Globex platform. This monitor uses a matrix-style format. The outrights are displayed along… more
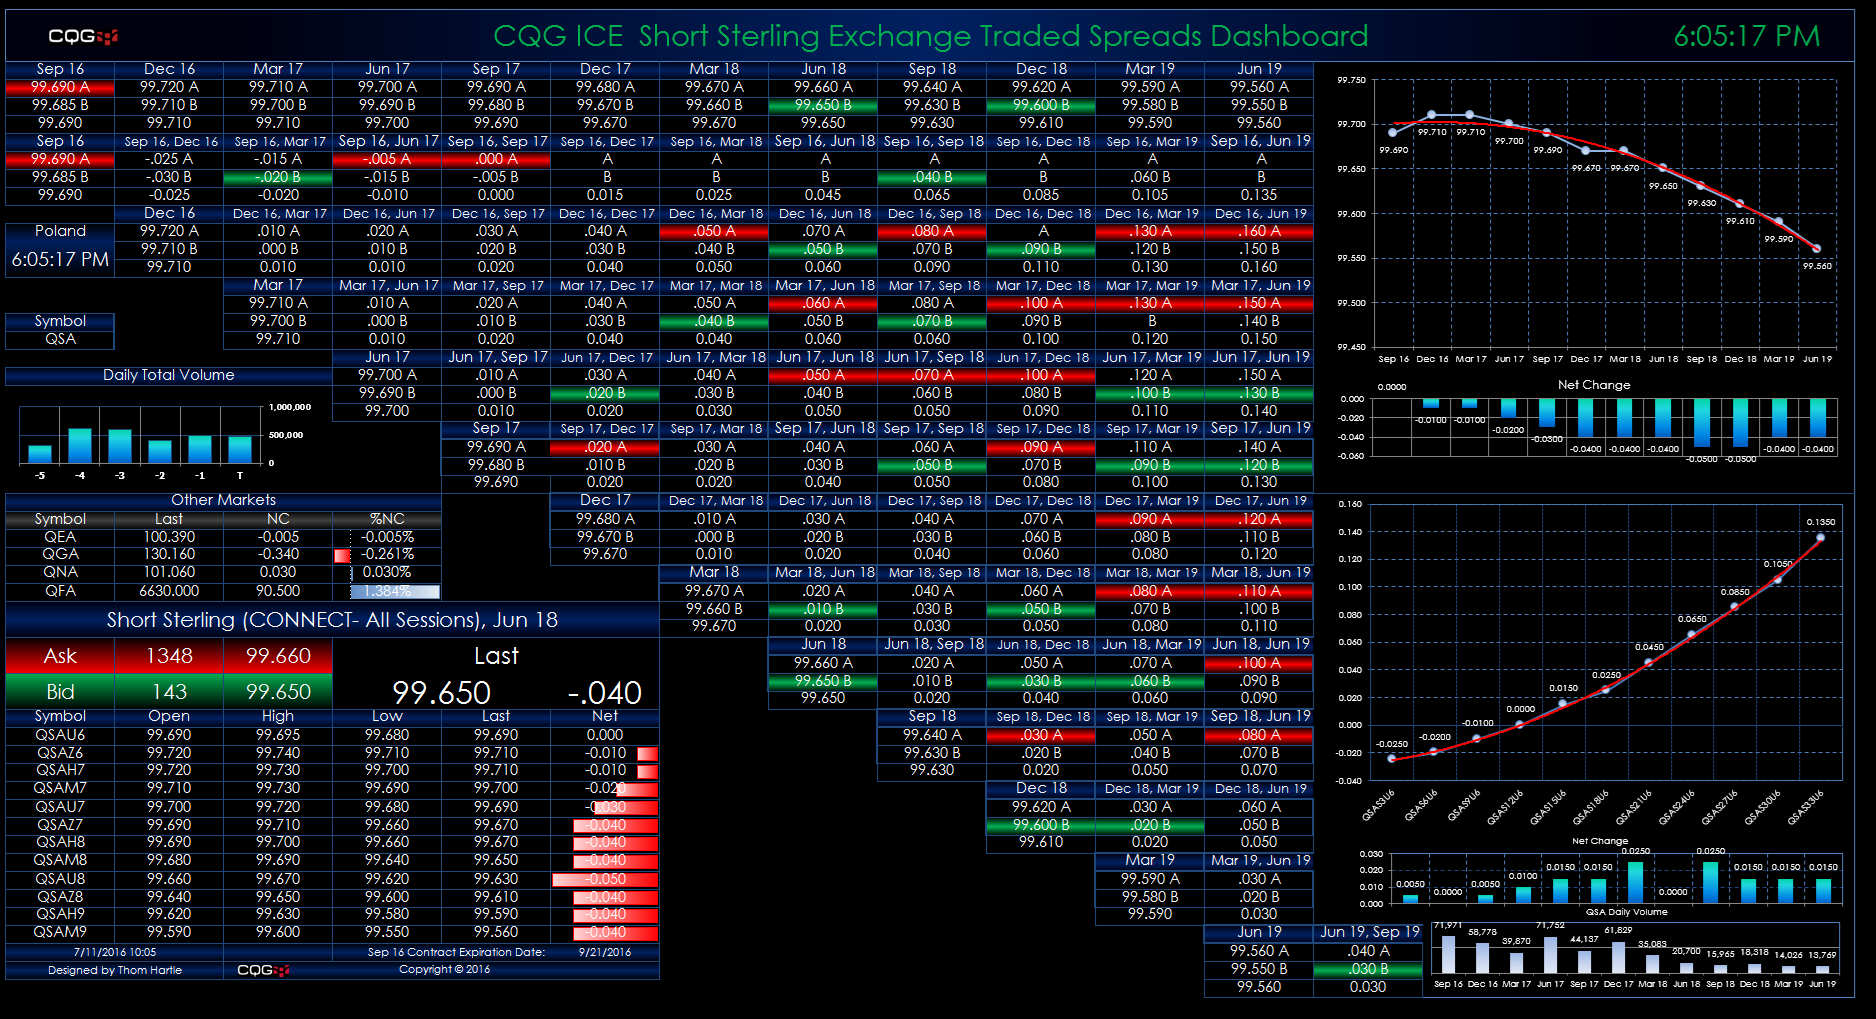
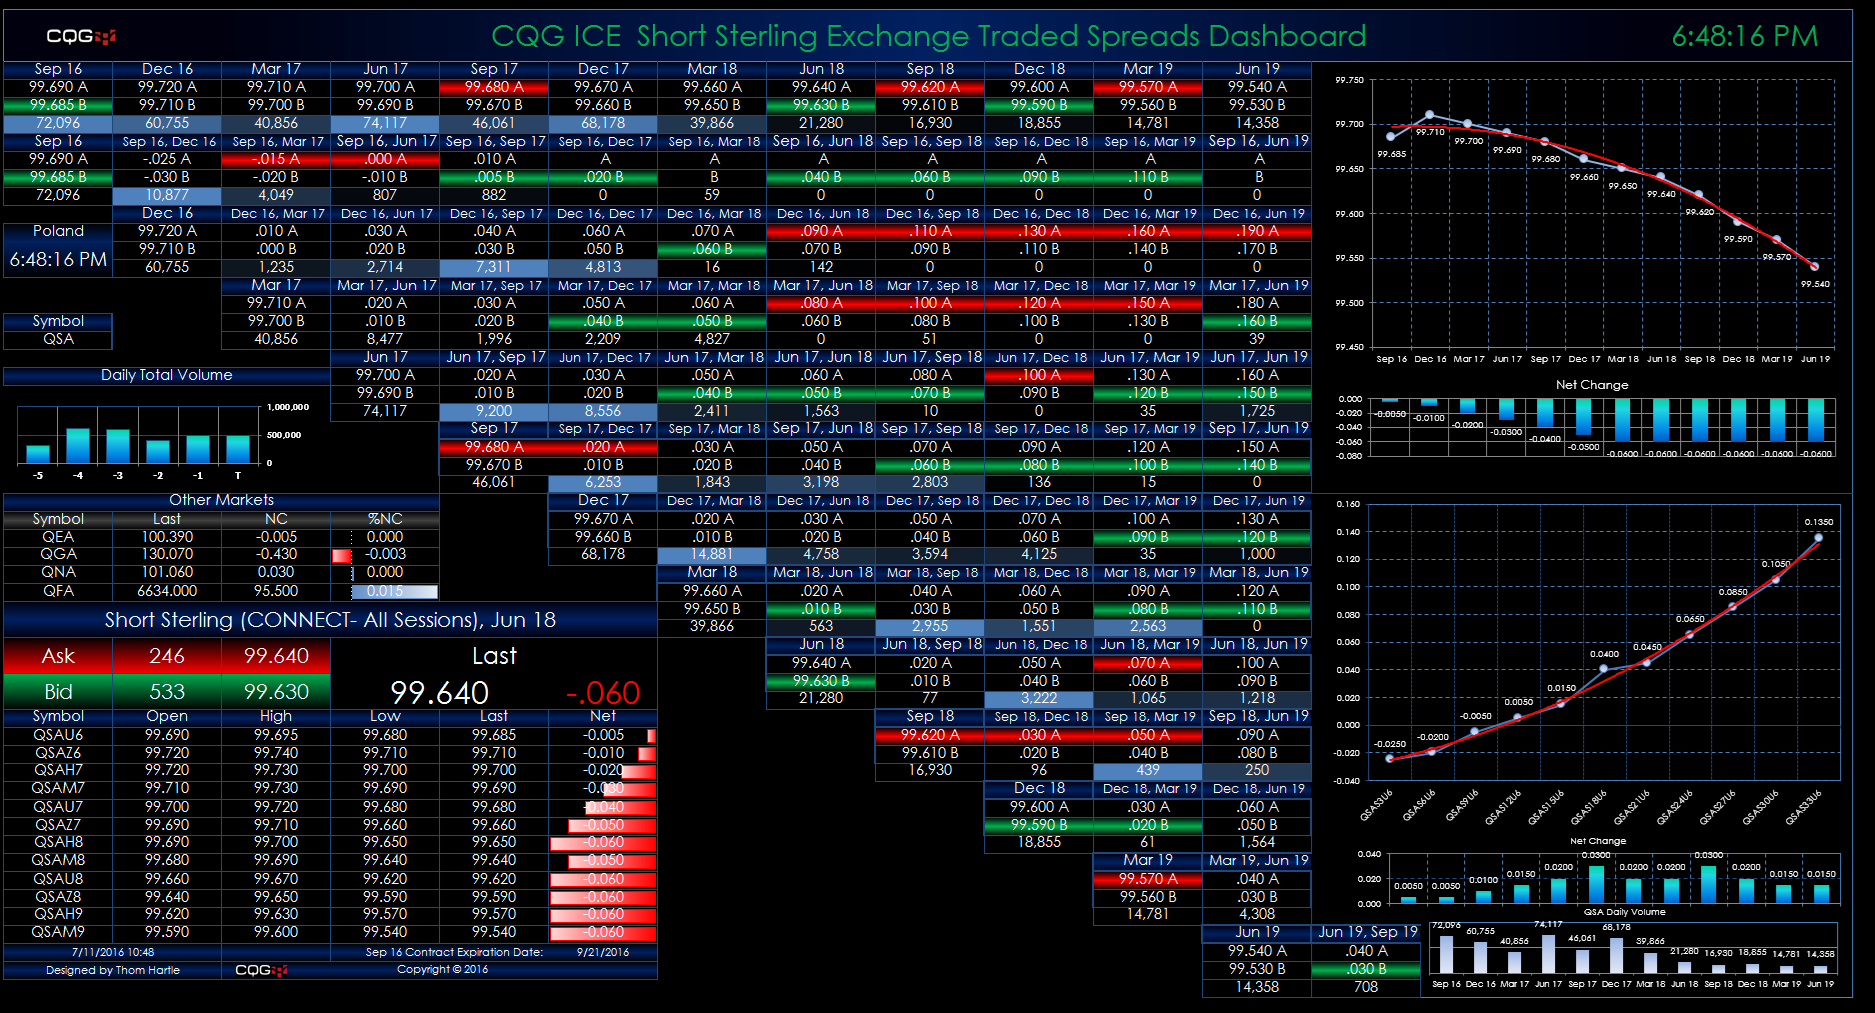
This Microsoft Excel® dashboard displays market data for Short Sterling calendar spreads traded on the ICE platform. This monitor uses a matrix-style format. The outrights are displayed along the… more
This Microsoft Excel® dashboard displays market data for Short Sterling calendar spreads traded on the ICE platform. This monitor uses a matrix-style format. The outrights are displayed along the… more
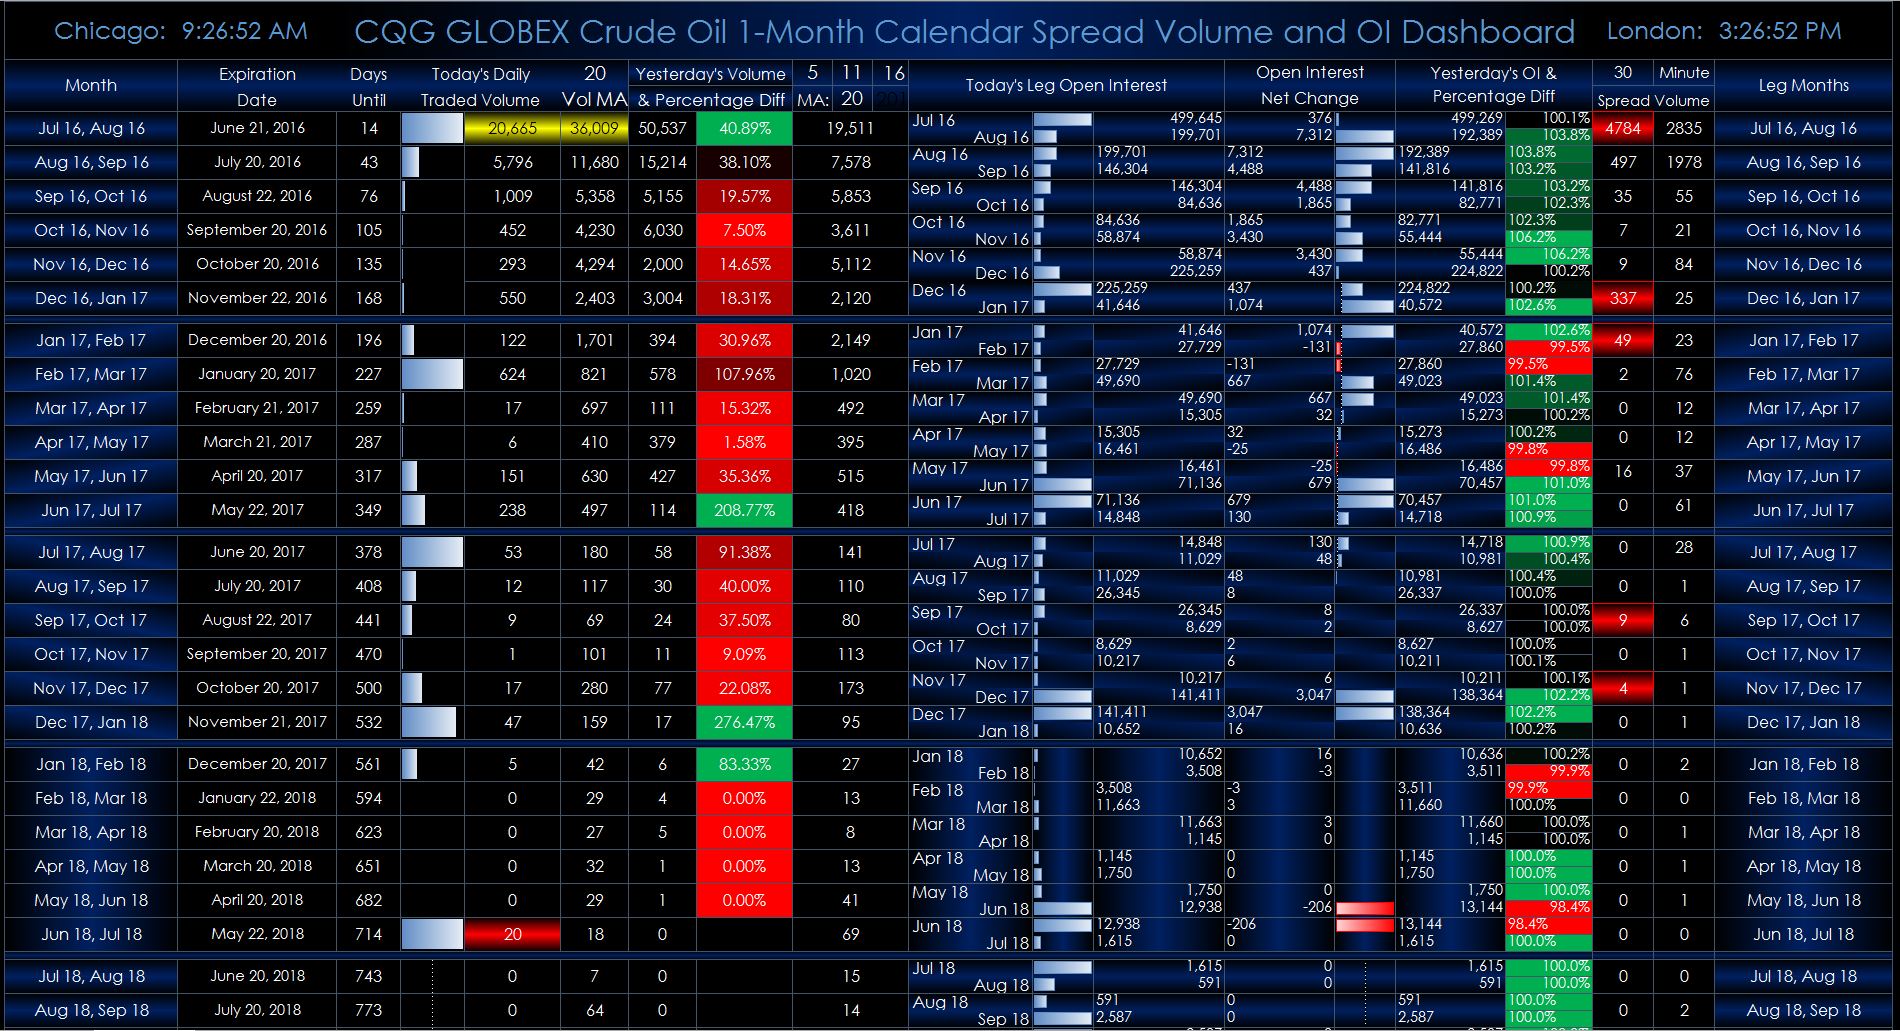
This Microsoft Excel® dashboard displays individual one-month crude oil calendar spreads traded on CME Globex and their individual legs for tracking the volume and open interest rolls. All of… more
