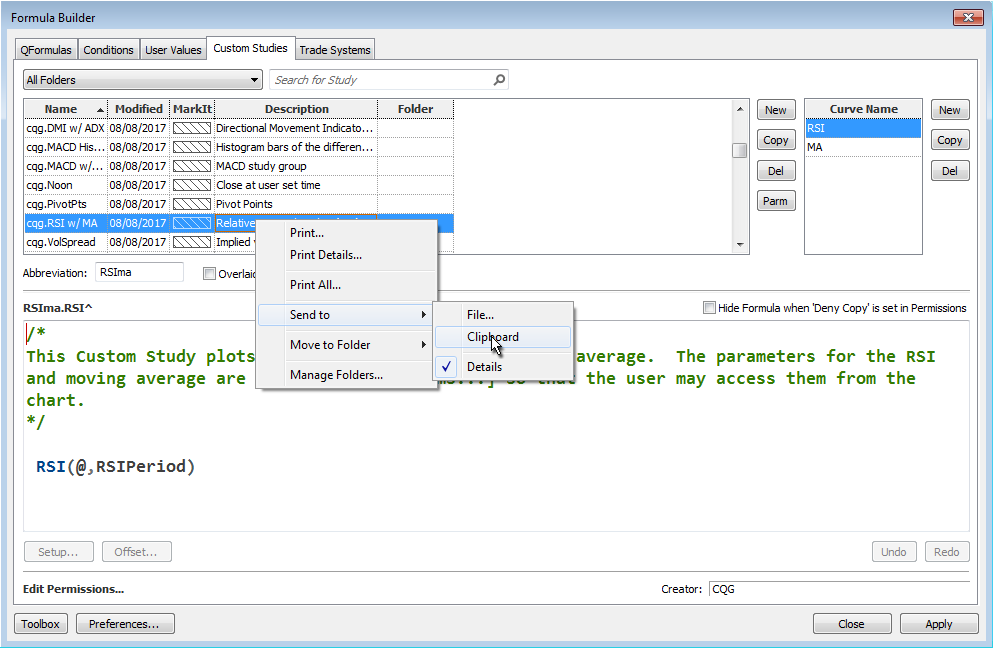
There are numerous Excel samples that walk you through bringing various market data into Excel using RTD formulas. However, there is a lot to look through. One solution is to use the CQG Formula Builder. You can right-click a study, hover your mouse over Send to, select Clipboard, and then paste the information onto your Notepad.
The following is all of the information brought over for the cqg.RSI w/MA study. The information we need is highlighted in bold below.
cqg.RSI w/MA: -- Overlaid = FALSE

Parameters:

RSIPeriod = 9

MAPeriod = 10

Curve 'RSI (Display String)

/*

This custom study plots the RSI with a trailing moving average. The parameters for the RSI and moving average are defined under Parameters so that the user may access them from the chart.

*/

RSI(@,RSIPeriod)

Curve 'RSI (Study String)

/*

This custom study plots the RSI with a trailing moving average. The parameters for the RSI and moving average are defined under Parameters so that the user may access them from the chart.

*/

RSI(@,Period:=RSIPeriod,InputChoice:=Close)

-------------------------------------------------------

Curve 'MA (Display String)

/*

Note the @ in the MA formula has been replaced with RSI. This was done by highlighting just the @ symbol and using the Formula Toolbox to replace it.

*/

MA(RSI(@,RSIPeriod),Sim,MAPeriod)

Curve 'MA (Study String)

/*

Note the @ in the MA formula has been replaced with RSI. This was done by highlighting just the @ symbol and using the Formula Toolbox to replace it.

*/

MA(RSI(@,Period:=RSIPeriod,InputChoice:=Close),MAType:=Sim,Period:=MAPeriod,InputChoice:=Close)

-------------------------------------------------------
Now that we have all of this information, we can use the critical information in an RTD formula.
First, this particular study uses the Parameters feature in the Formula Builder, which are labeled RSIPeriod and MAPeriod. We have to replace them with values. Also, the @ sign needs to be replaced with a symbol. We use 9 and 10 respectively and the symbol CLE (crude oil).
There are two versions: the Display String and the Study String.
MA(RSI(CLE,9),Sim,10) MA(RSI(CLE,Period:=9,InputChoice:=Close),MAType:=Sim,Period:=10,InputChoice:=Close)
The Display String uses a default setting, such as Close, while the Study String allows you to use other parameters, such as Mid (midpoint of the bar) instead of Close.
RTD formulas allow the use of the symbol parameter as a study using Bar and Close (here, 5-minute bars):
=RTD("cqg.rtd",,"StudyData","MA(RSI(CLE,9),Sim,10)","Bar",, "Close", "5",,,,,,"T")Or
=RTD("cqg.rtd",,"StudyData","MA(RSI(CLE,Period:=9,InputChoice:=Close),MAType:=Sim,Period:=10,InputChoice:=Close)","Bar",, "Close", "5",,,,,,"T")The sample spreadsheet uses links to change the symbols and the parameters. A section providing sample symbol formats for chart types other than bar chart is also included.
Requires CQG Integrated Client or CQG QTrader and Excel 2010 or higher.